On this page
- 1. We Split Monitoring into Measurement, Evaluation, and Delivery
- 2. Add Labels to Metrics
- 3. We Changed Alert Thresholds from Block Counts to Time
- Add a duration condition
- Treat missing data as an alert condition too
- 4. We Split the Alert Path into Page and Investigate
- If there are dozens of alerts a day, people stop looking
- 5. Having Monitoring Tools Is Not the Same as Being Monitored
- 6. The Actual FP Validated Architecture
- We physically separated measurement from evaluation
- We enforce label values in CI
- We centralized all evaluation rules in one Git repository
- We generate absence-detection rules automatically from the node inventory
- We redefined “normal” for each chain
- We split the alert path into two independent routes
- We record maintenance-time alert suppression in Git as well
- We validate monitoring configuration before merge
- Deployment does not rely on manual intervention
- We separated dashboards from alert execution
- Summary
When a validator node stops, it costs money. The real questions are how many minutes it takes to notice that it has stopped, who notices and based on what evidence, and whether that information actually reaches the person on call at 3 a.m.
Suppose we monitor block lag with the same threshold of 300 blocks across every chain. When we measured the actual block times, 300 blocks worked out to roughly 60 minutes on Ethereum and about 1.3 minutes on Arbitrum. The exact same monitoring rule therefore means leaving a problem unattended for an hour on one chain and for only 1 minute 20 seconds on another.
In this article, while operating 15 nodes and around 10 chains, the measurement, evaluation, and delivery process
1. We Split Monitoring into Measurement, Evaluation, and Delivery
Exporters turn system state into metrics, Prometheus evaluates rules, and Alertmanager delivers the results to the people responsible. These three stages fail in different ways.
Measurement — turning state into numbers
We attach an exporter to each server. It continuously reports values such as CPU (Central Processing Unit) usage, remaining disk space, the latest block the node has caught up to, and the number of connected peers. Each individual value is called a metric.
Evaluation — deciding whether those numbers are abnormal
We define conditions such as “disk usage is above 90%,” “no signal has arrived for 10 minutes,” or “block height has not changed for 5 minutes.” These conditions are called alert rules. They are essentially one-line conditional statements.
Delivery — getting the evaluation result to a person
When a condition is met, we decide who should be notified, through which channel, and how often. Should we wake someone by phone? Post it to chat? Re-notify them about the same incident every few hours? Those decisions belong here.
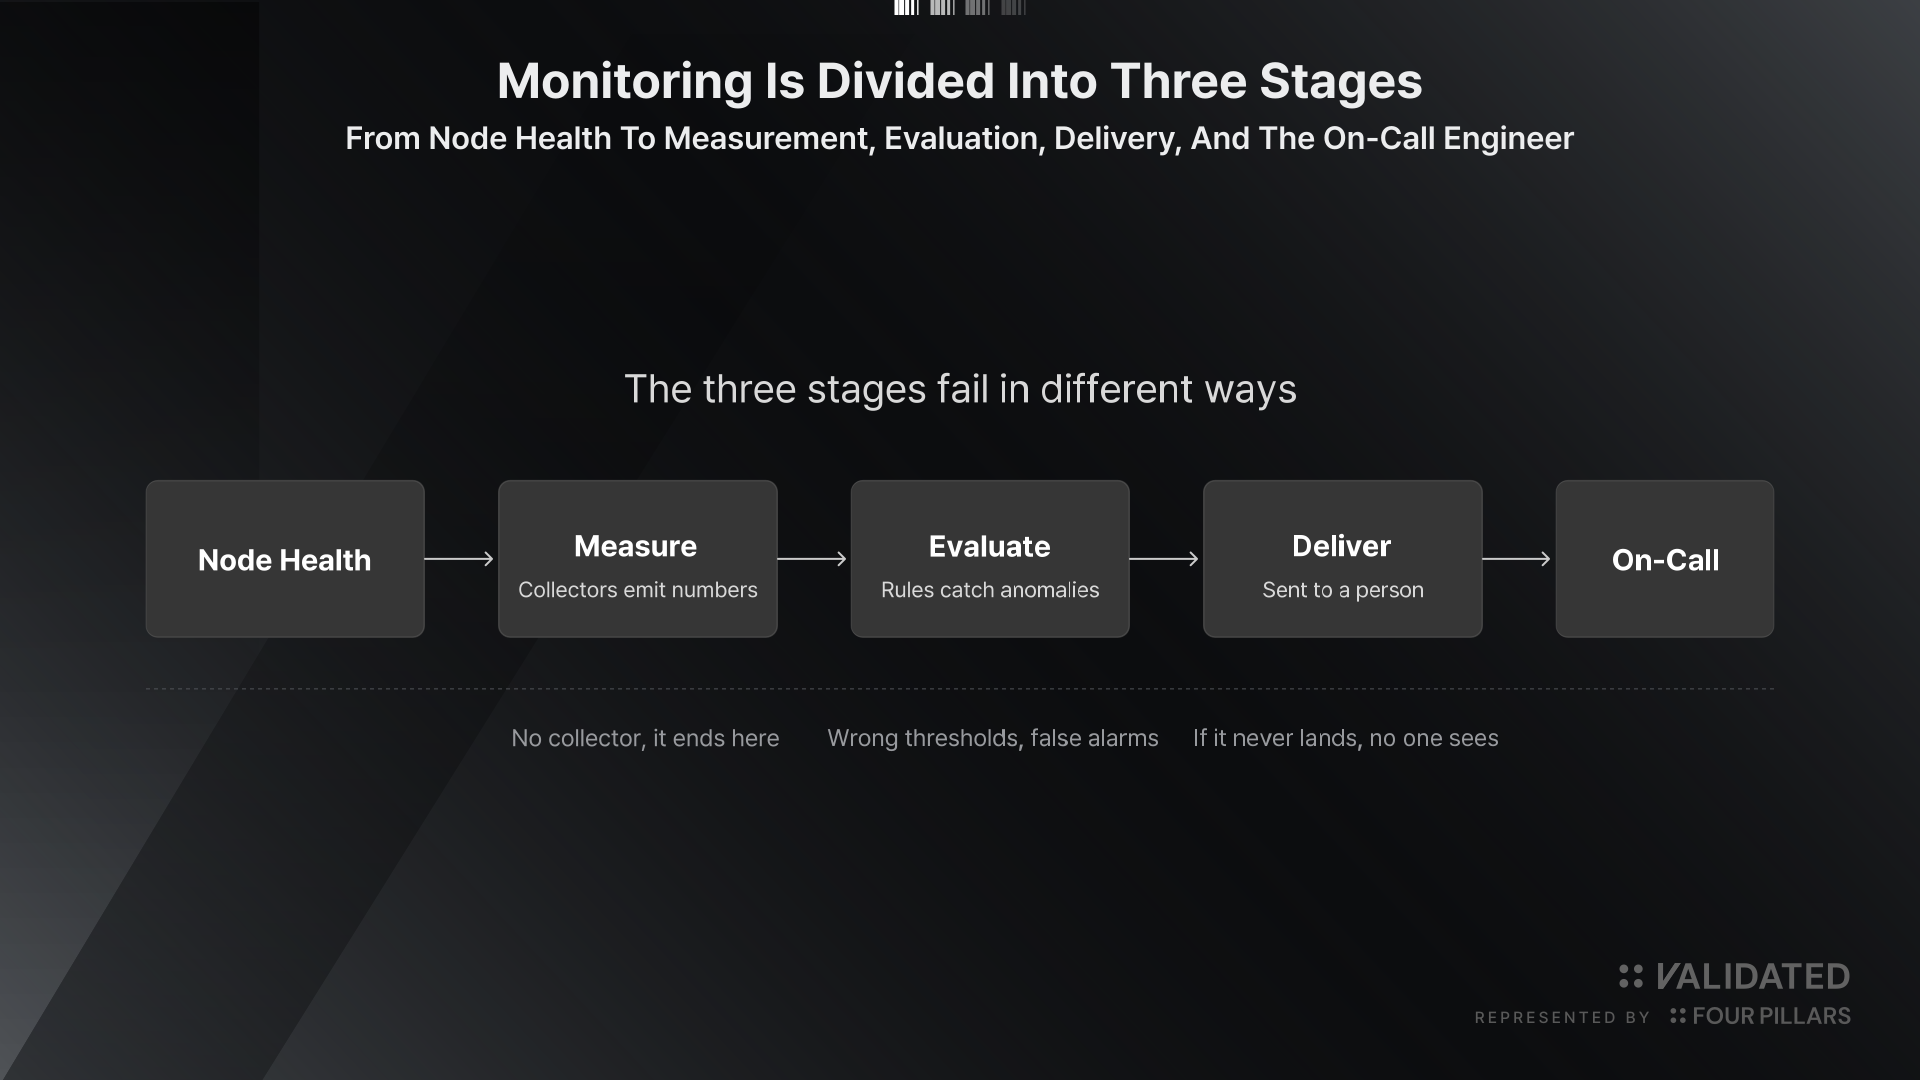
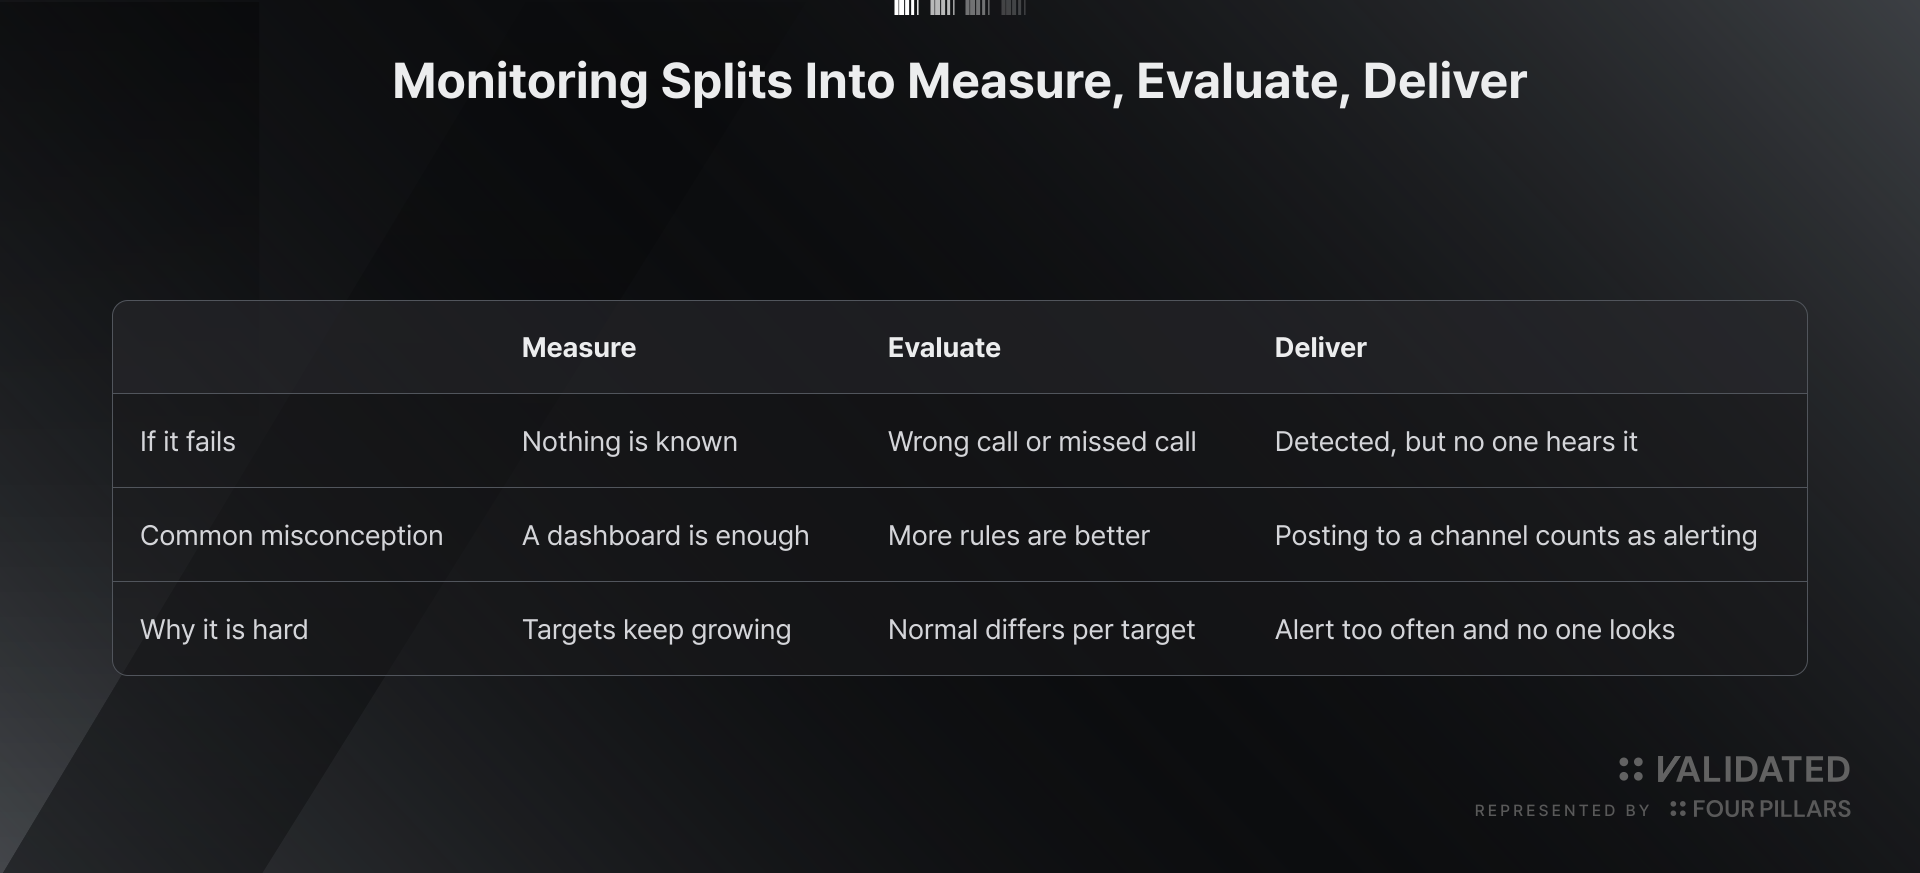
Even with dense measurement coverage, an incident can be missed if the thresholds do not match the characteristics of each chain. Even with accurate evaluation, nobody will know at night if alerts only remain in a chat channel. We have had a missing-target alert repeatedly fire because one node had the wrong label value, and we also found that block-count-based thresholds created as much as a 46× difference in detection time between chains.
2. Add Labels to Metrics
With three nodes, you can still look at three graphs manually. With 15 nodes, each responsible for multiple chains, you need to be able to ask something like “show me all mainnet validators with fewer than three peers” in a single query.
That is why we attach labels to every metric. A line stored centrally actually looks like this.
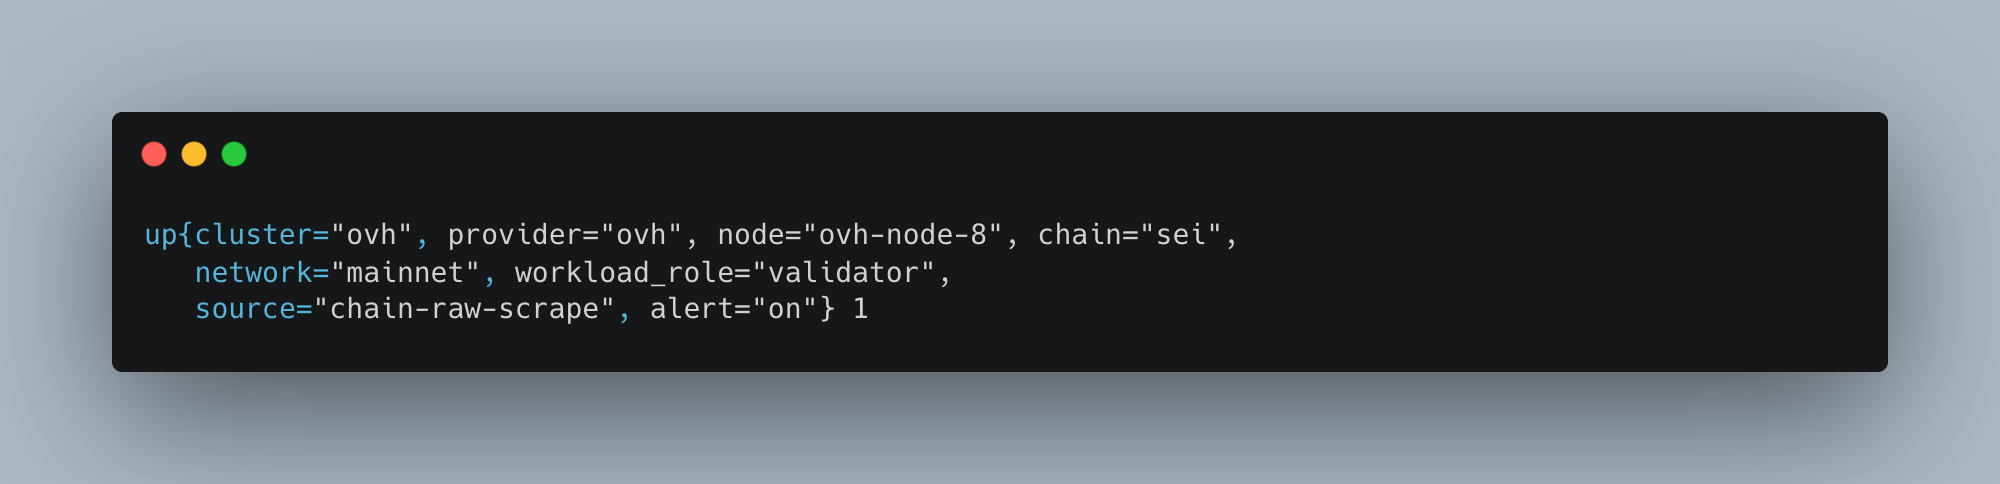
The leading up means “collection from this target succeeded,” and the trailing 1 is its value. Everything inside the braces is a label. We standardize on the following ten labels.
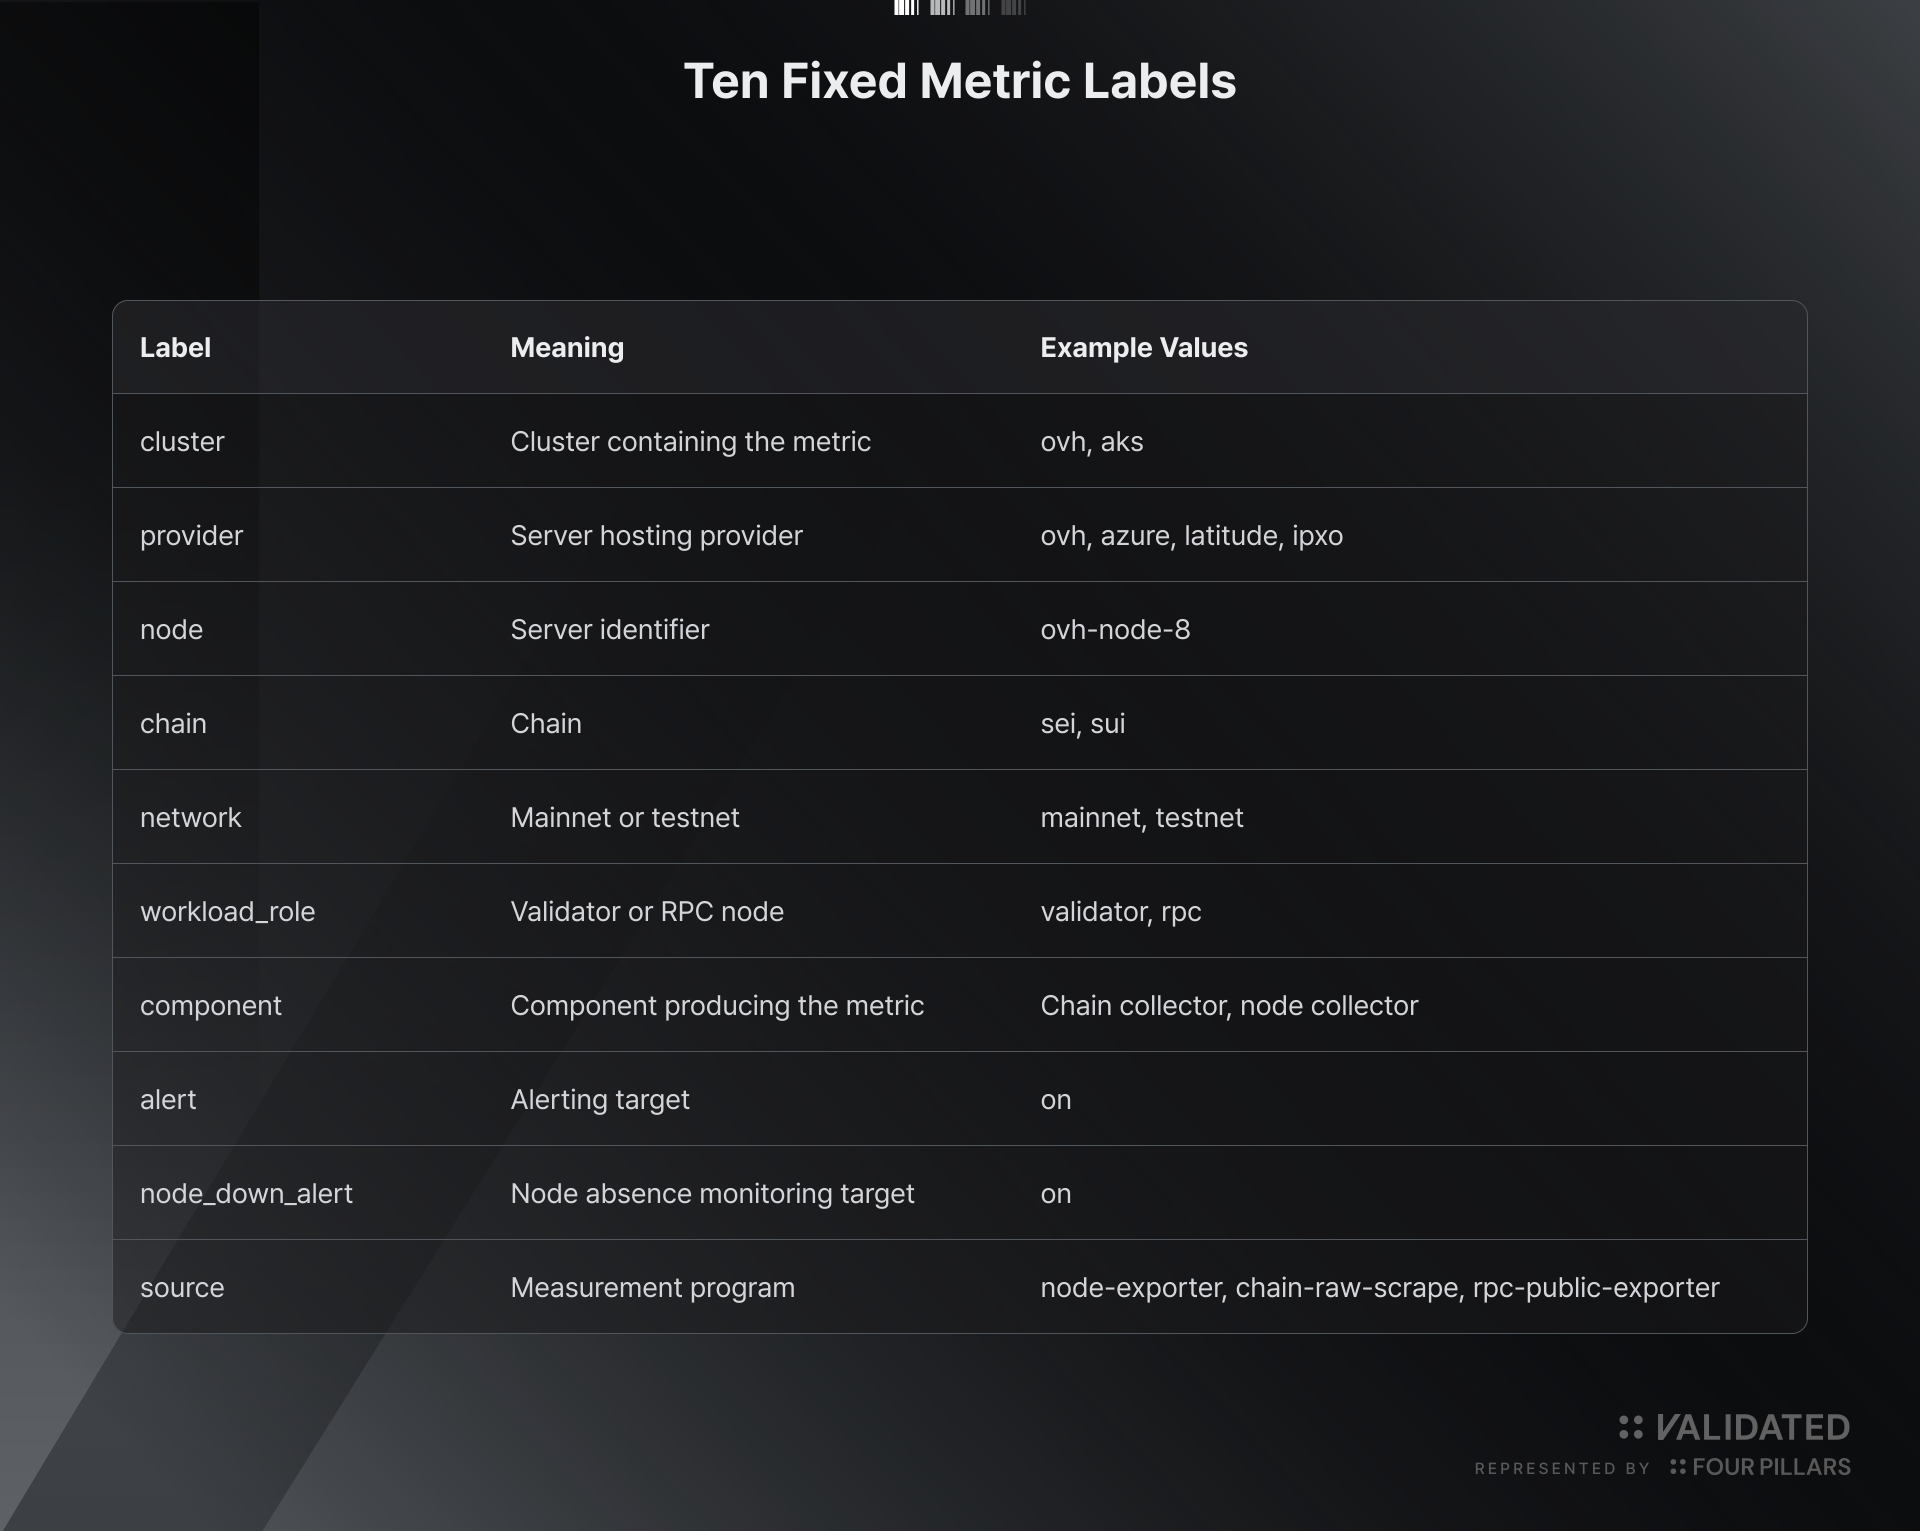
Once labels are in place, evaluation rules do not need to be written separately for every target. “All mainnet validators designated for monitoring” can be selected with a single expression. When we add another node, the rule stays the same; only the labels have to follow the contract.
Without labels, adding more targets means copying more rules. Once you have thirty rules, it becomes difficult to tell which ones are actually active.
We fixed the semantics of cluster to mean the cluster a node belongs to and provider to mean the company from which the server is rented. If the two are used interchangeably, “a server rented from OVH” and “a server that belongs to the OVH cluster” become indistinguishable, and rules start looking at the wrong targets. We once had a node whose cluster value was set to external, causing repeated false absence alerts. Fixing one value in each of two files resolved the issue.
3. We Changed Alert Thresholds from Block Counts to Time
We started with a rule that said, “alert when the node falls 300 blocks behind.” After measuring live block intervals across ten chains, we found that the time represented by 300 blocks varied dramatically.
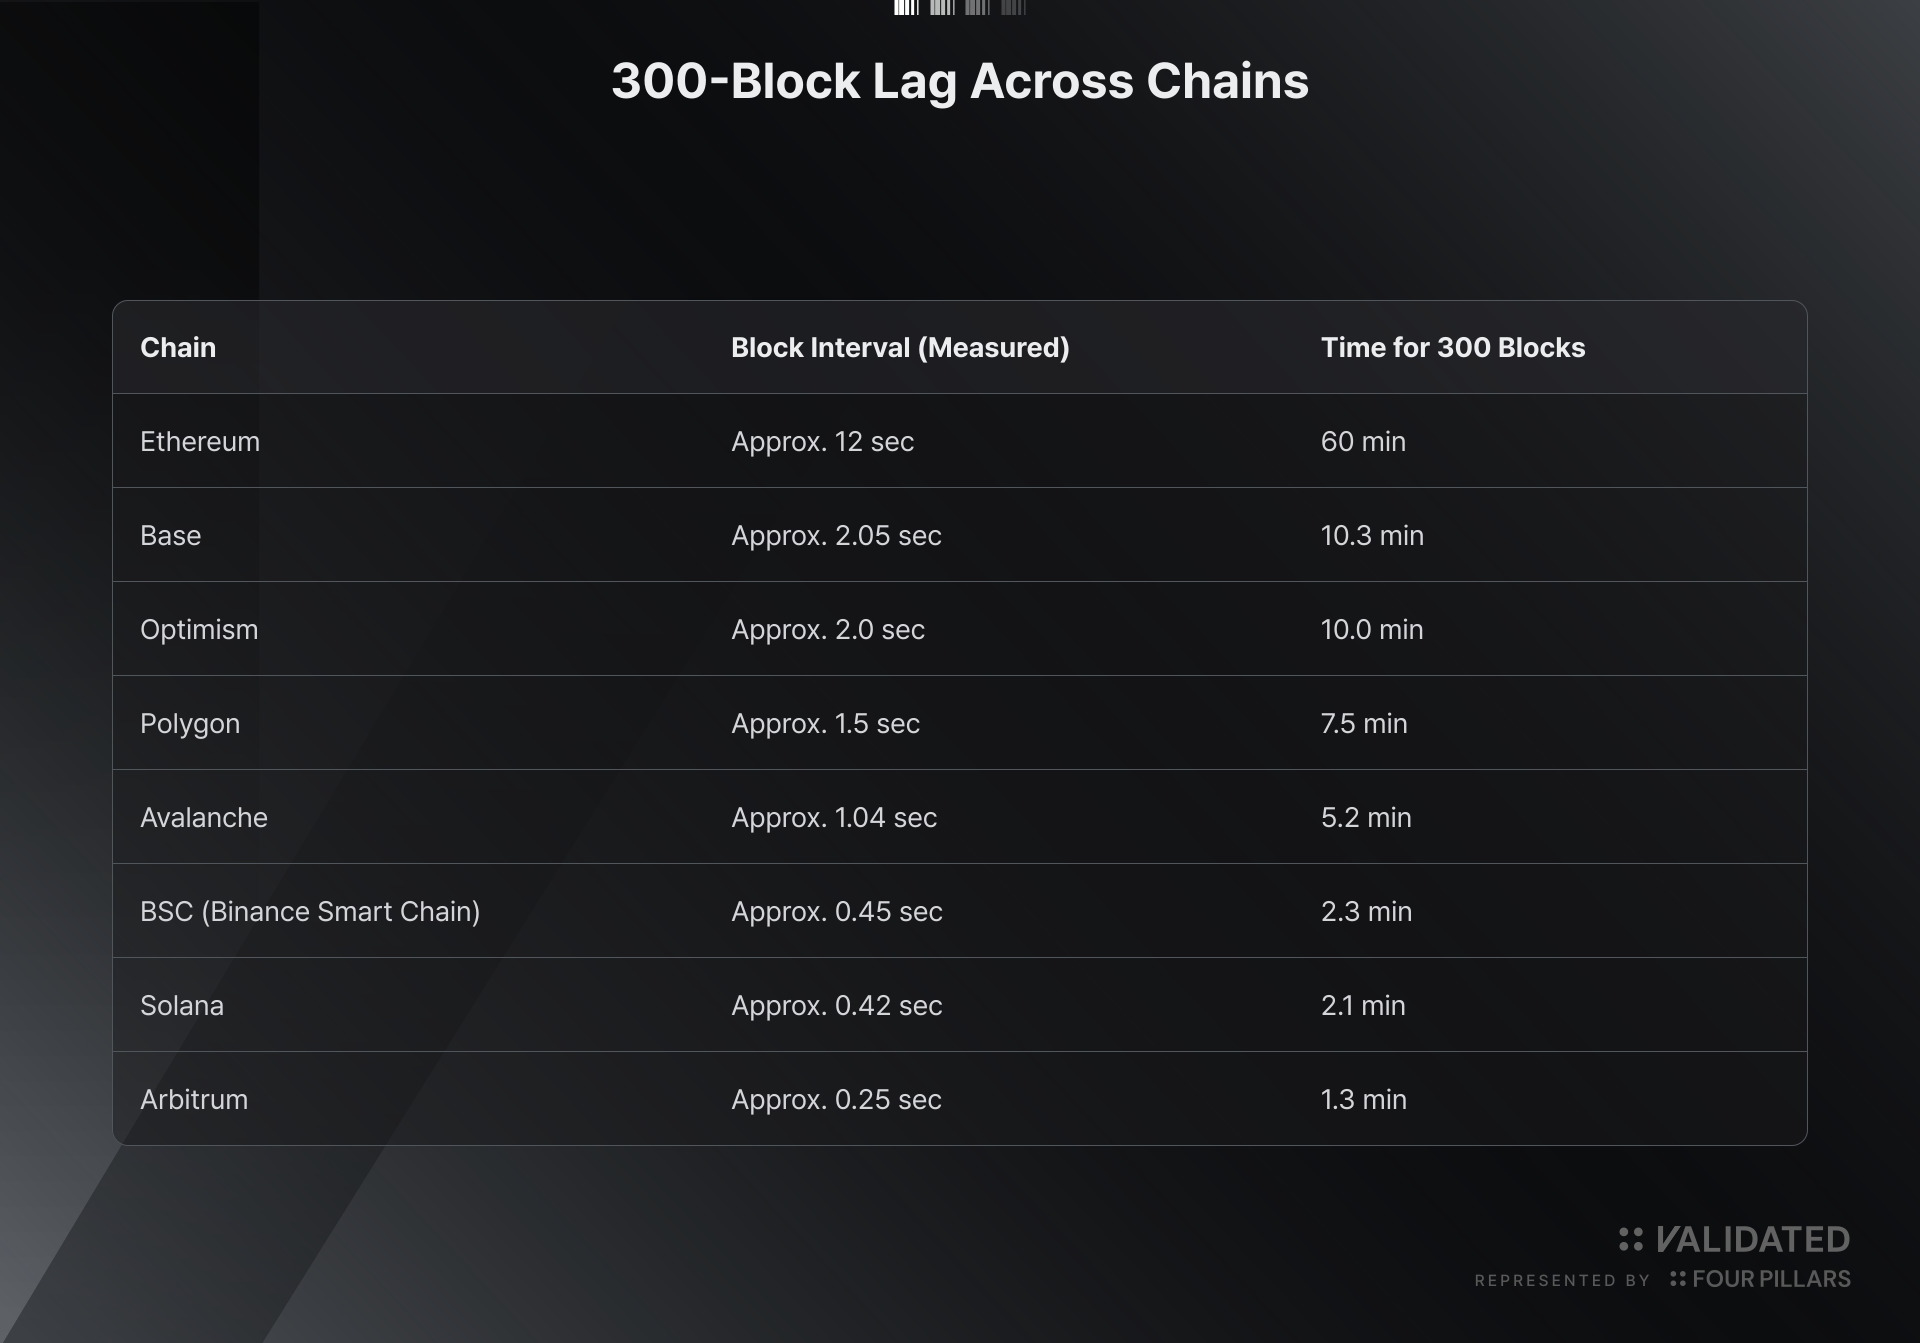
The same single rule means “leave it unattended for an hour” on Ethereum and “1 minute 20 seconds” on Arbitrum. That is a 46× difference. On Ethereum, an incident can go undetected for an hour; on Arbitrum, even a brief fluctuation can trigger an alert and wear people down.
So we standardized the threshold in seconds: “alert if the node remains more than 10 minutes behind for 15 minutes.”
Add a duration condition
A single scrape can fail, or a process can become briefly busy and make the value spike. If we alert the moment a threshold is crossed, we page people for conditions that would have recovered on their own. That is why every rule also includes a condition for “how long this state must persist.” Too short creates noise; too long delays detection.
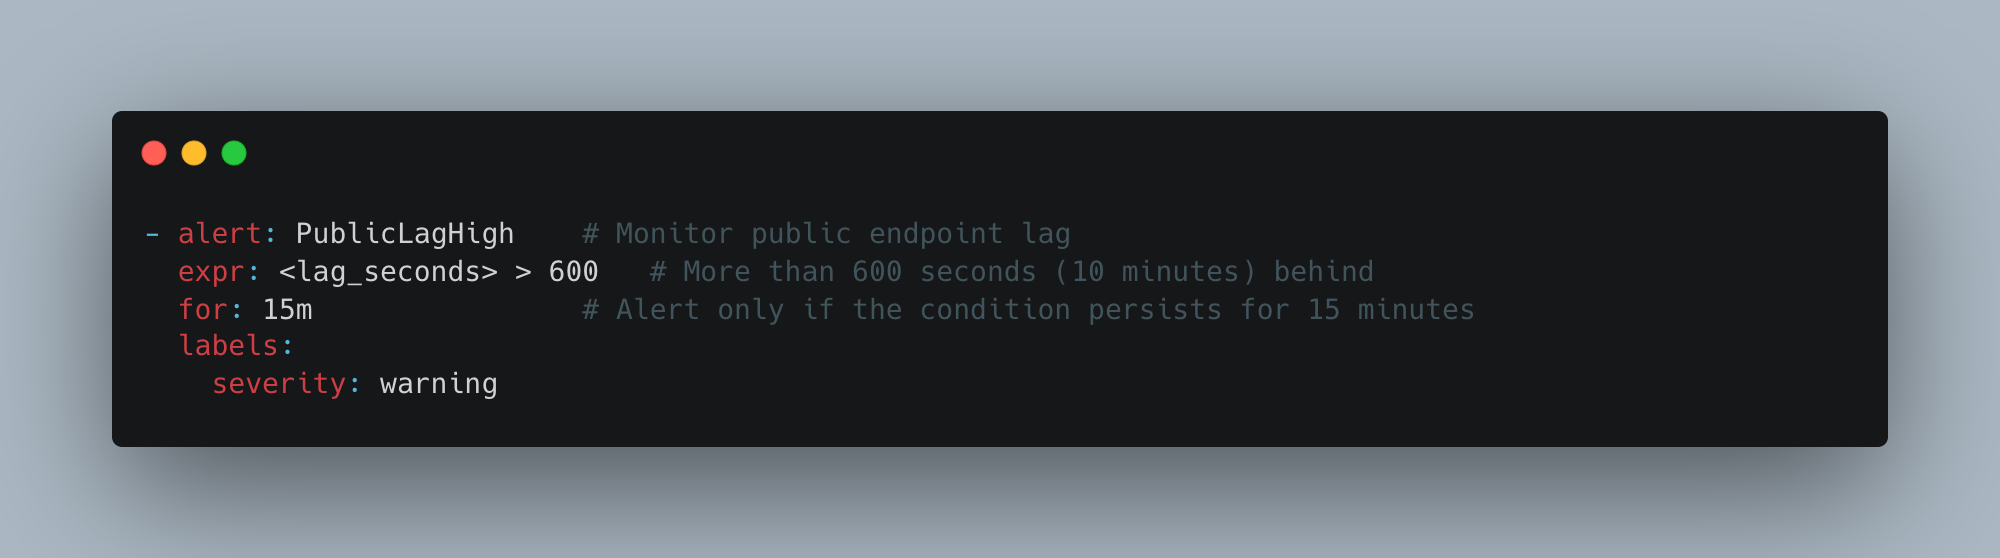
for is the duration. Without this line, the alert fires as soon as the expression reaches the threshold.
Treat missing data as an alert condition too
Most rules look for abnormal values: high CPU, a full disk, or a block height that has stopped increasing.
But if the server is dead, the network is disconnected, or the exporter itself is down, not even an abnormal value arrives. A rule that says “alert when the value is high” stays silent when there is no value at all, making silence look like health.
So we also use the opposite kind of rule: “alert if this server has produced no signal at all for 10 minutes.” We call this absence detection.
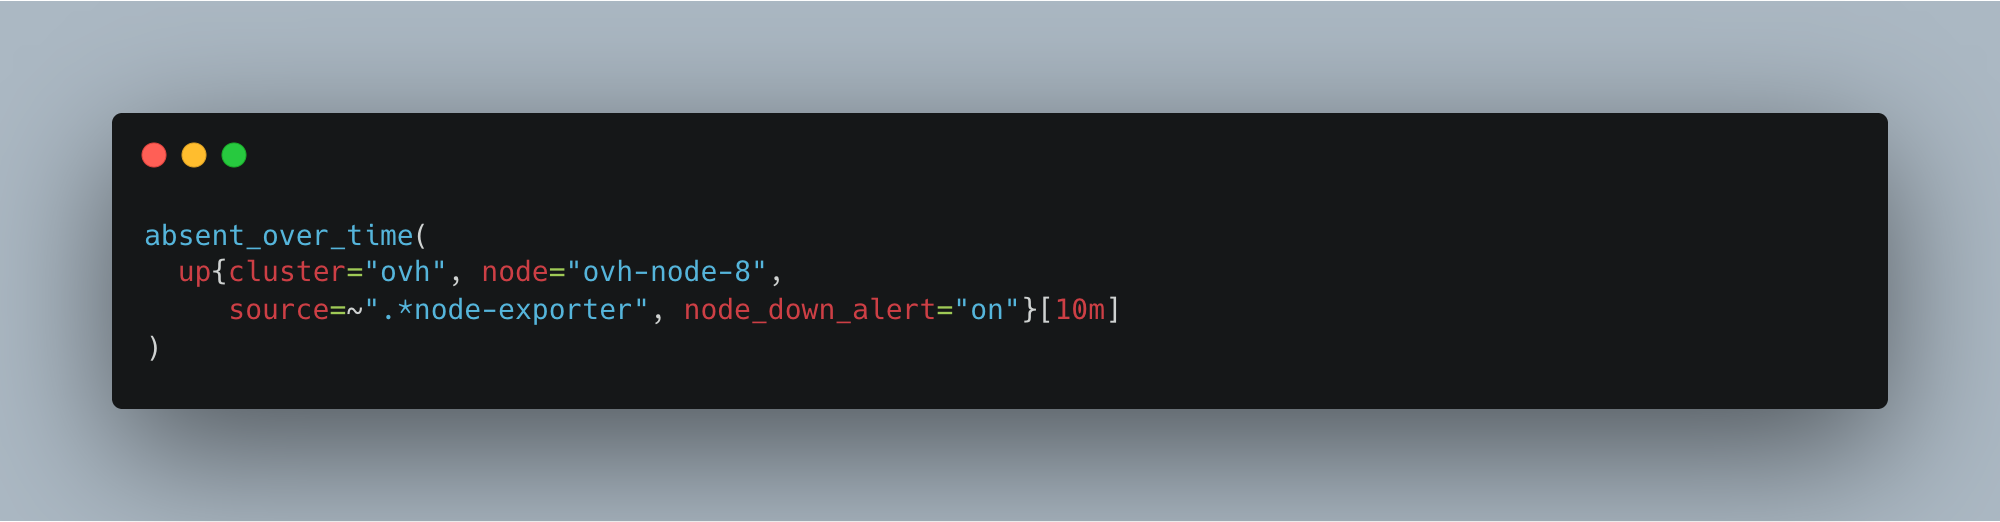
absent_over_time returns a value only when that signal has been completely absent for 10 minutes. In other words, the absence of a value becomes the condition itself.
Absence detection requires an inventory of expected targets. To know that something disappeared, you first need a list of what is supposed to exist. If adding a node also requires someone to manually add another entry to a separate list, eventually something will be forgotten. The omission itself is silent, and that node can keep running outside the monitoring boundary.
In FP Validated, absence-detection rules are generated automatically from the node inventory file. Adding a node generates the corresponding rules as well, and CI blocks the merge if the two become inconsistent.
4. We Split the Alert Path into Page and Investigate
A Page must reach someone even when they are asleep at night, and if that person does not respond, it must escalate to the next person. The primary requirement here is reachability; information density comes second.
Investigate means identifying the affected server, opening logs, checking graphs, and reviewing recent changes. Starting from scratch, this typically takes a person 10 to 30 minutes.
If both are forced into one channel, a phone page cannot carry a full investigation, while a well-structured chat message cannot wake someone who is asleep.
If there are dozens of alerts a day, people stop looking
When dozens of alerts arrive every day, operators mute the channel or scroll past them. At that point, accurate rules no longer matter.
Alert fatigue usually comes from four sources.
- The same incident keeps repeating. The alert continues every five minutes while the problem persists.
- Related alerts arrive separately. One server dies, and ten things running on it each send their own alert.
- Severity is not differentiated. Something that requires getting out of bed immediately and something that can wait until morning arrive in the same way.
- Targets under maintenance keep alerting. Everyone already knows about the condition, but the alerts continue anyway.
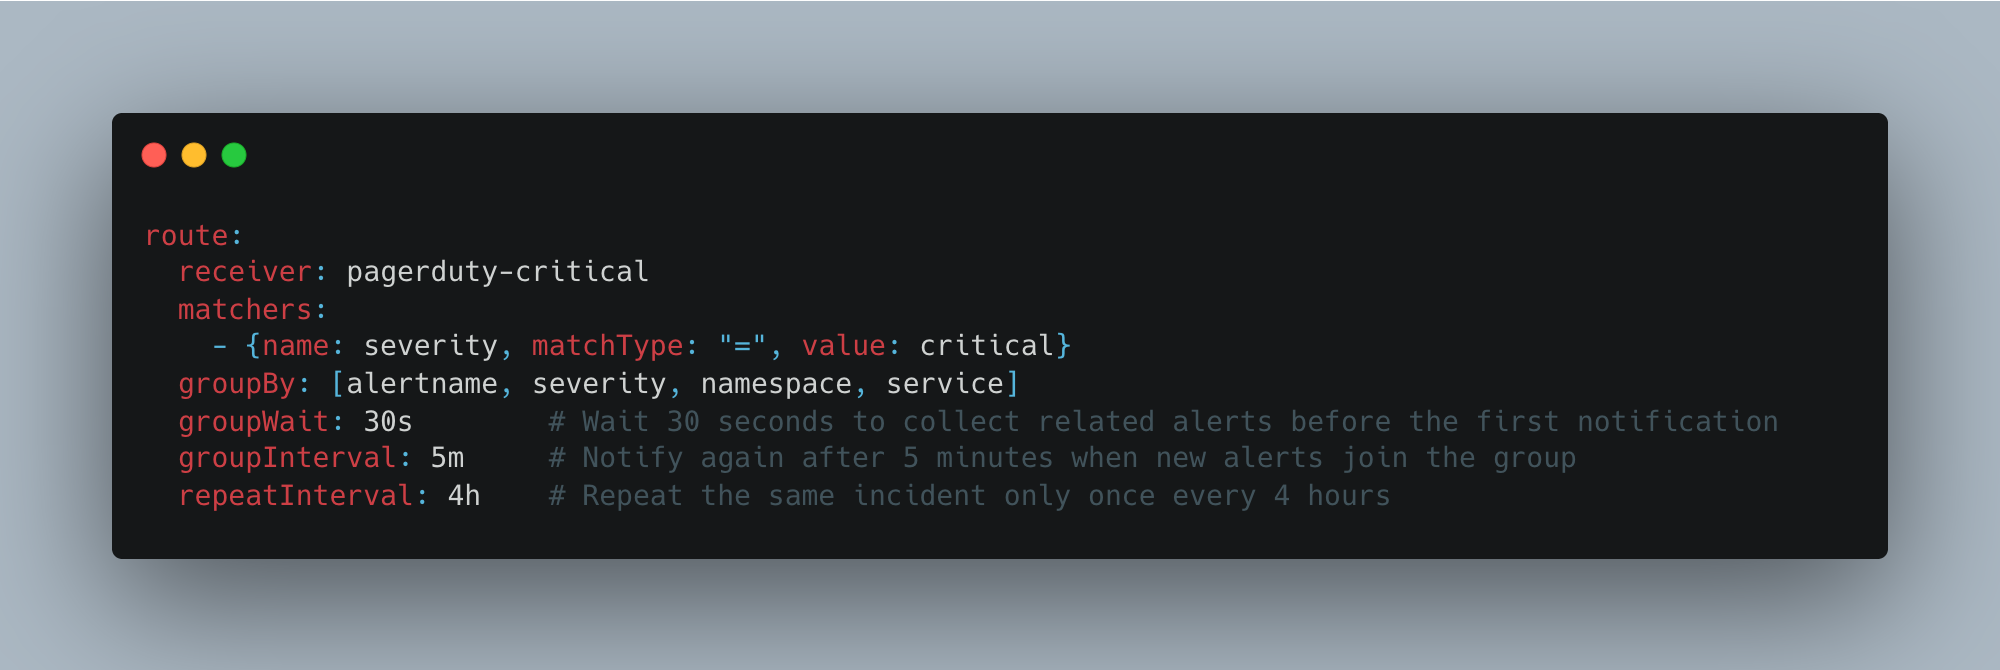
So we configure grouping and suppression in the notification path. Related alerts are grouped into one notification, the same incident is repeated only at a defined interval, channels are separated by severity, and planned maintenance is excluded in advance.
There will always be times when alerts need to be temporarily disabled for maintenance. The problem is turning them off in a way that leaves no record anywhere. A few days later, someone asks, “Why didn’t this alert fire?” and nobody knows how many nodes are currently outside monitoring coverage.
5. Having Monitoring Tools Is Not the Same as Being Monitored
Prometheus and Grafana are open-source tools, and it takes only a day to start a server and attach a dashboard. But even forty dashboards do nothing while nobody is looking at them, and extending metric retention helps post-incident analysis but has nothing to do with detecting incidents quickly.
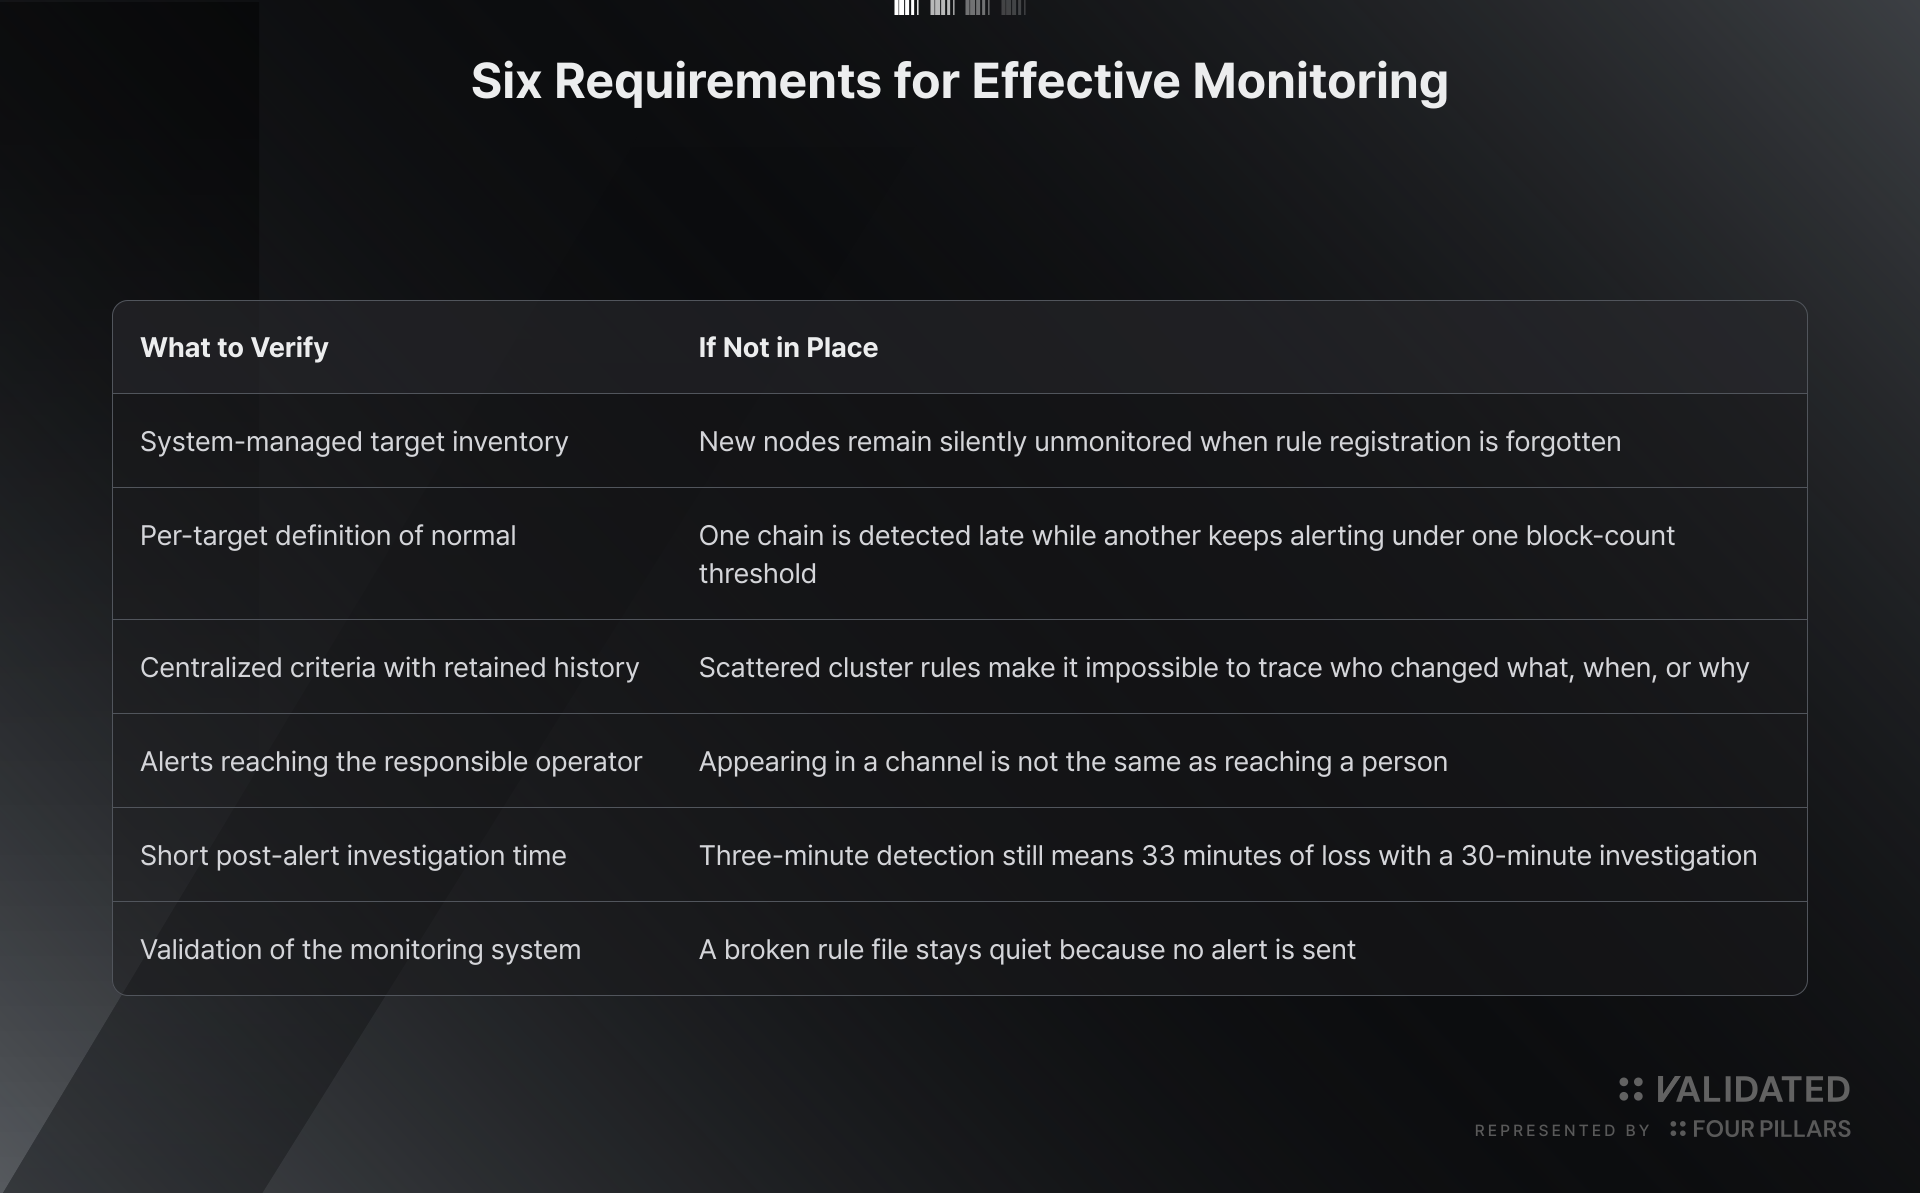
The actual work is in the following six areas. Section 6 shows how FP Validated handles each one.
6. The Actual FP Validated Architecture
Our infrastructure consists of two Kubernetes clusters.
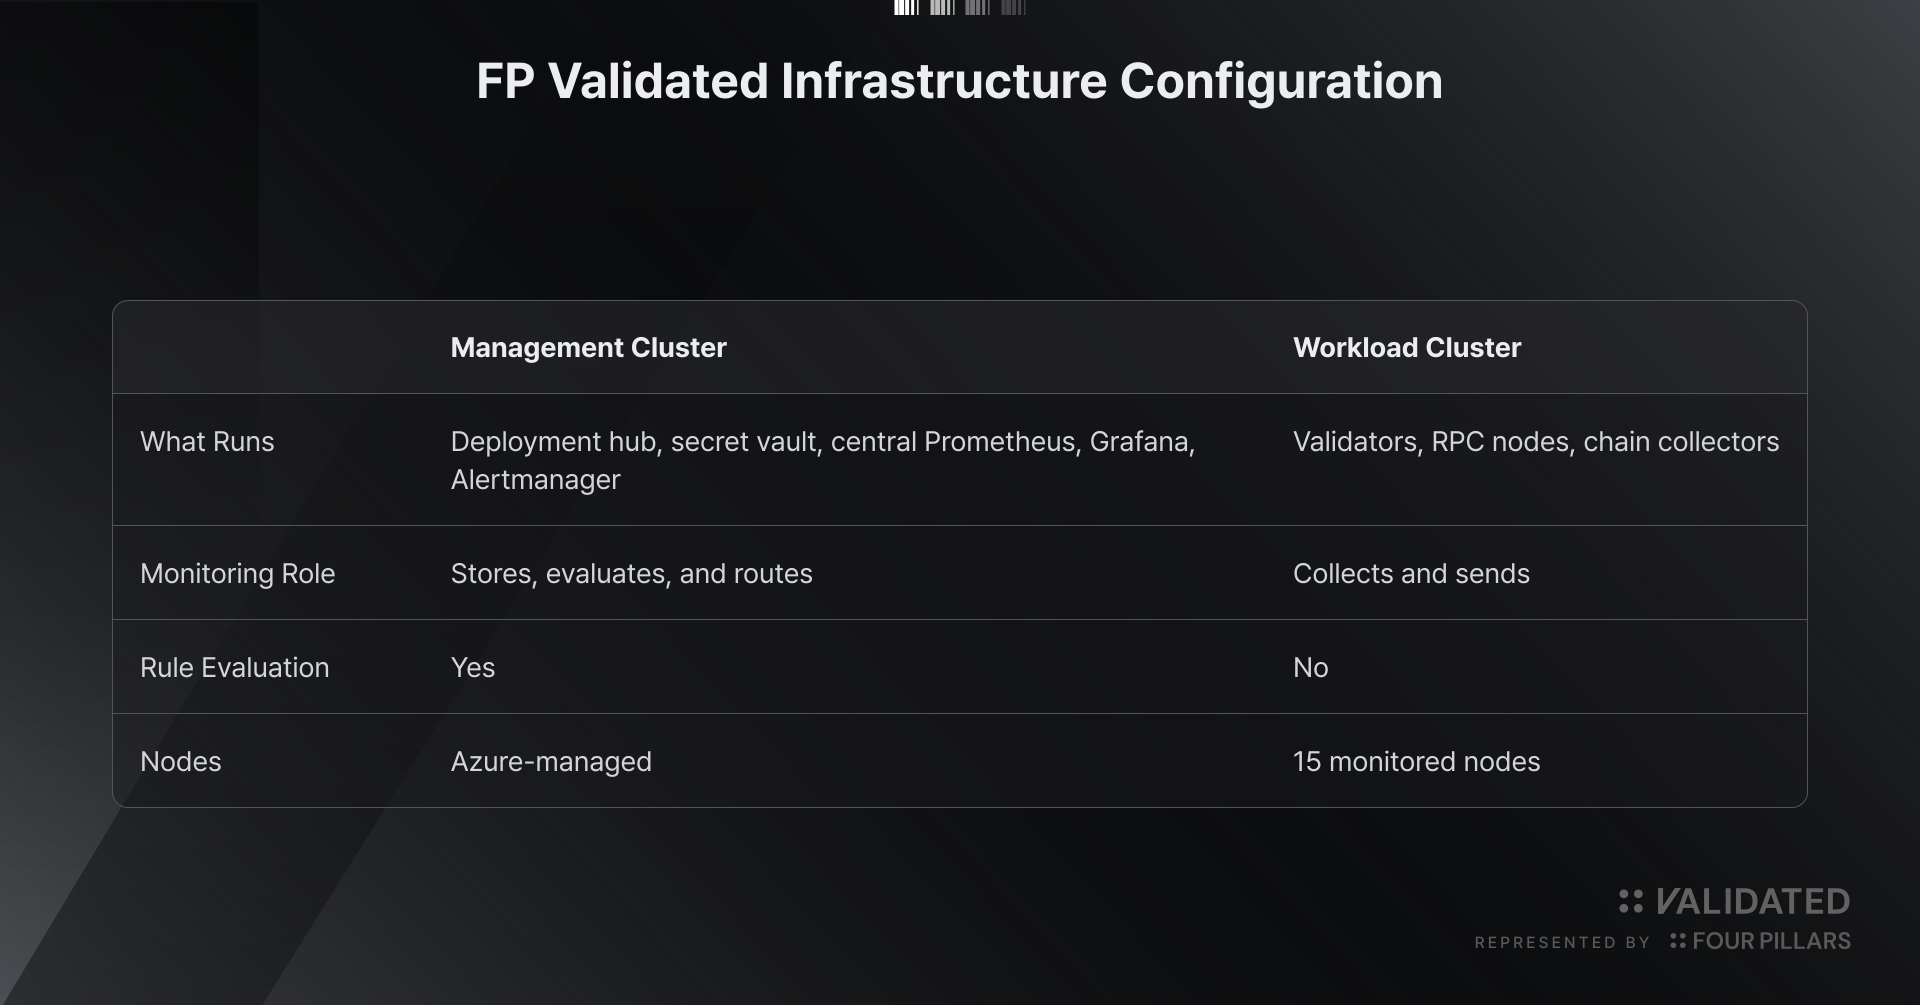
The stack includes edge and central Prometheus instances, Alertmanager, Grafana, PagerDuty, Slack investigation cards, and Argo CD to deploy all of it. The architecture is as follows.
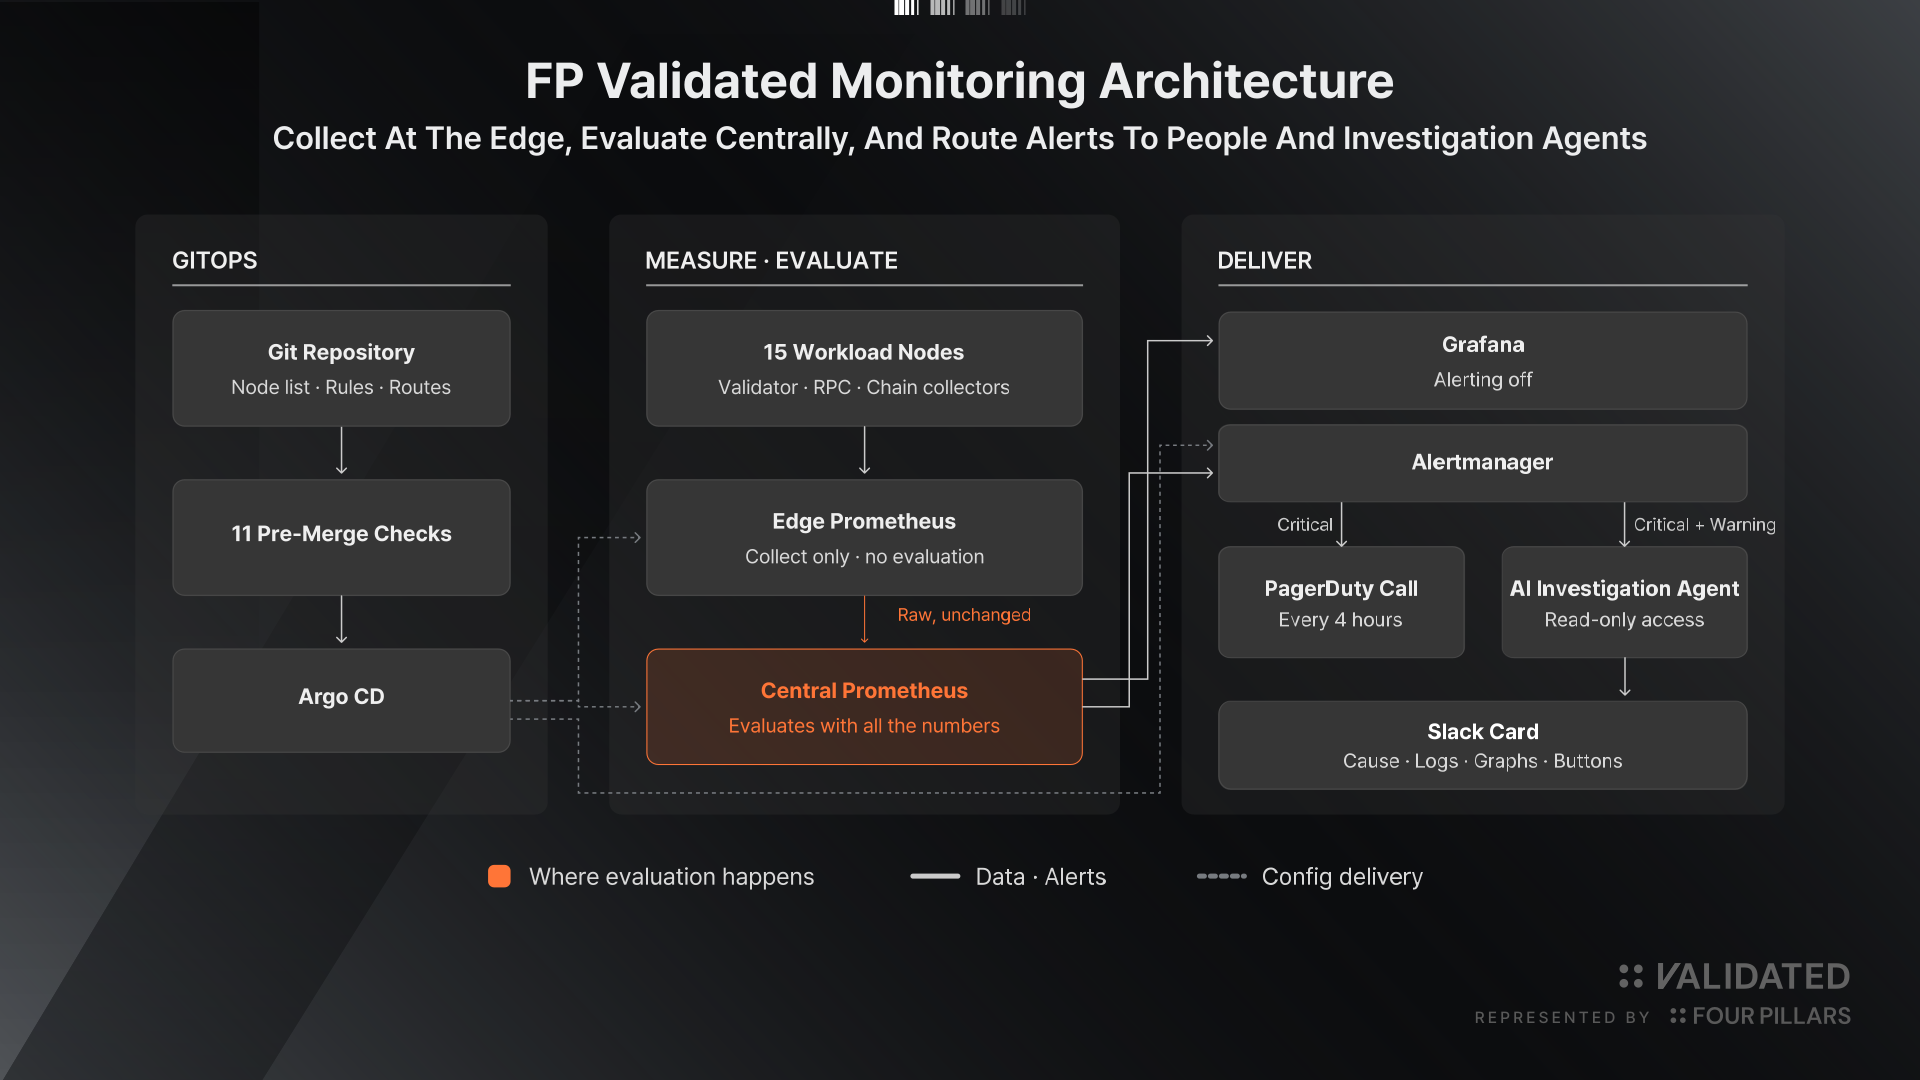
We physically separated measurement from evaluation
We separated the cluster where the nodes run from the cluster where monitoring decisions are made. Validators and RPC nodes run in a dedicated workload cluster, while storage and evaluation happen in a separate management cluster.
The edge Prometheus only collects and forwards data. It does not evaluate anything. Its configuration explicitly prevents it from loading evaluation rules. This keeps the definition of “normal” and “abnormal” from becoming fragmented across environments.
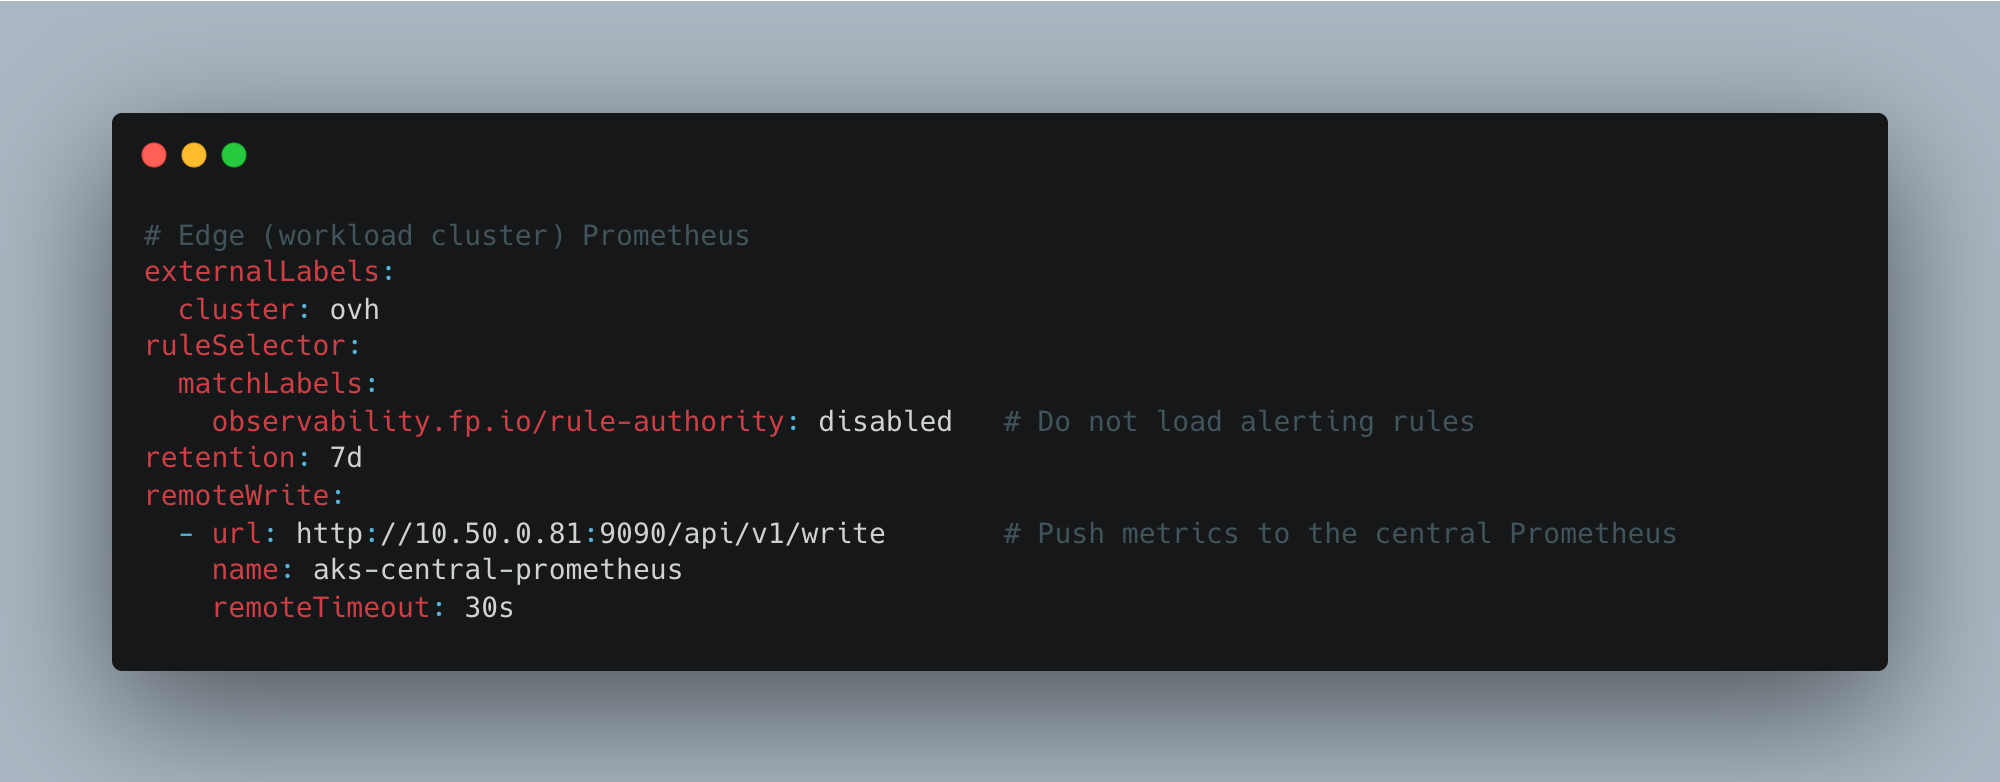
It is important that there is no filtering configuration under remoteWrite. We do not summarize or selectively forward collected metrics; we send the raw data as-is. Filtering would reduce transfer volume, but every new evaluation criterion would then require a field-side configuration change first. Since the whole point is to centralize evaluation, receiving the raw data centrally is the right trade-off.
Previously, the central system periodically pulled from the field using federation. We changed this to remote write, where the field pushes to the central system. That migration required eight changes across three repositories, and we verified the result as follows.
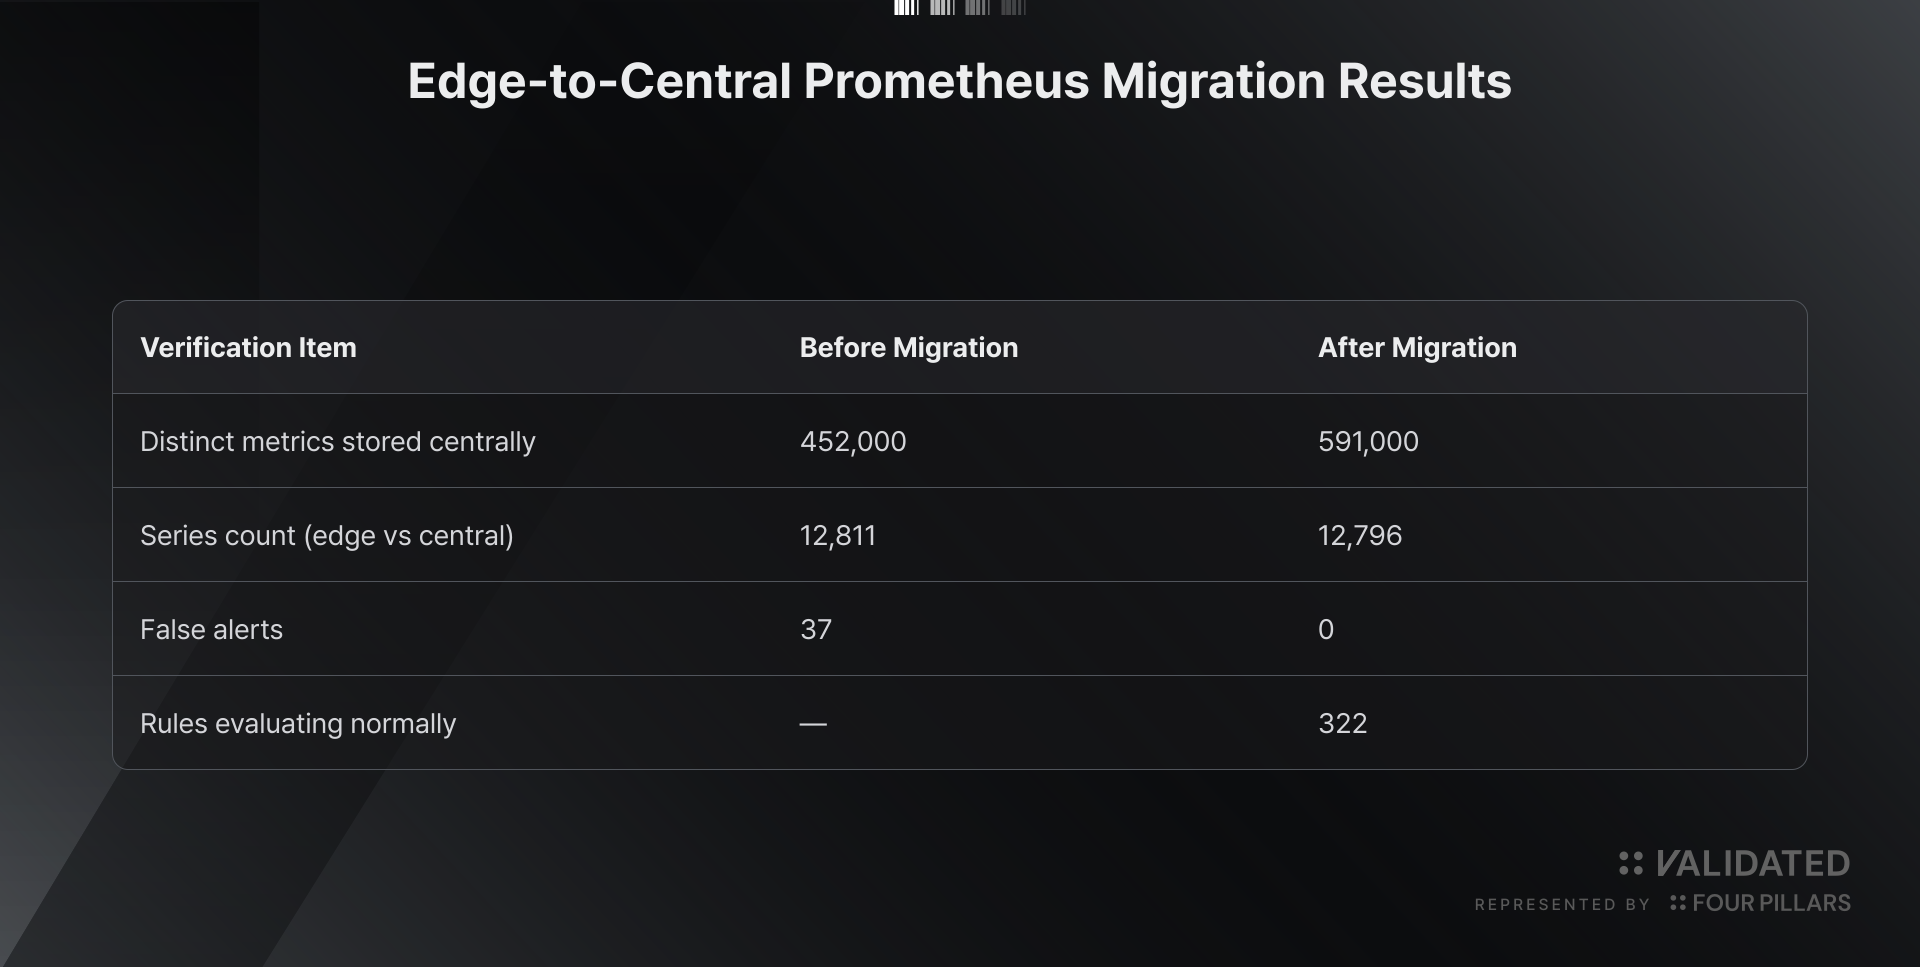
The number of metric series increased because series that had previously been filtered out began arriving unchanged. The near match between 12,811 on the edge and 12,796 centrally confirmed that we had not lost data during the migration.
We enforce label values in CI
We did not leave label semantics as a documentation convention; we made them testable contracts.
The ten labels introduced in Section 2 have the same meaning on every node. Each node’s label values are declared in both the node inventory file and the catalog, and if the two do not match, validation fails at merge time.
Once labels become a contract, rules no longer have to be multiplied per target. We currently run more than 100 evaluation conditions, but adding more targets does not require copying those rules.
We centralized all evaluation rules in one Git repository
Alert rules, dashboards, measurement configuration, and notification routes all live in a single Git repository. We removed any path that allows someone to manually insert a rule directly into the cluster. The pattern where the repository state becomes the cluster state is what we call GitOps.
There are 20 rule files containing more than 100 evaluation conditions. They are grouped as follows.
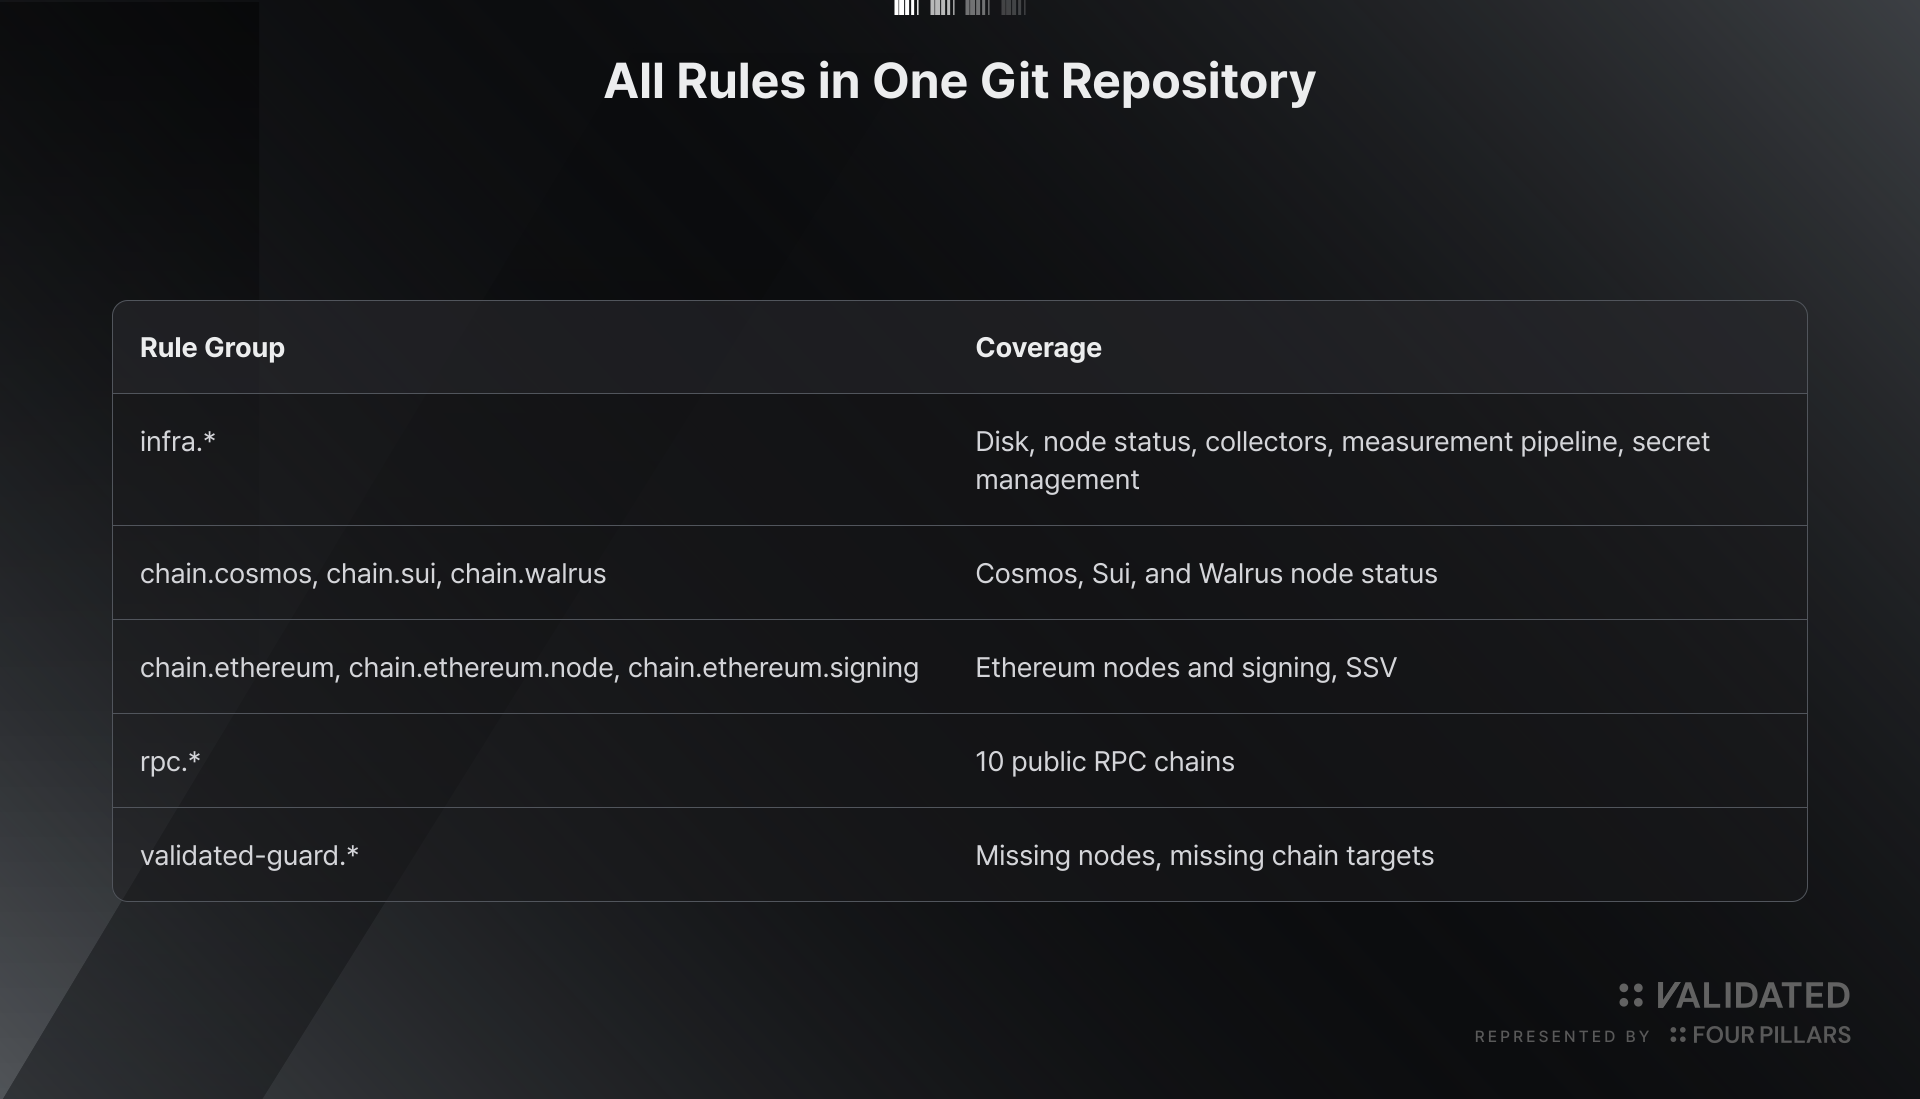 Every rule also carries a source label, so when we find a rule running live, we can immediately identify the repository and file it came from.
The reason these rules live in Git is that changing an alert criterion becomes equivalent to changing code. We retain a complete history of who changed what, when, and why, and rolling back is a single operation. At present, all 322 rules are operating normally.
We generate absence-detection rules automatically from the node inventory
Absence-detection rules are generated automatically from the node inventory file. When a node is added to the inventory, rules such as “alert if this node produces no signal for 10 minutes” and “alert if this chain target disappears” are generated automatically. Nobody has to edit a separate rule file by hand.
We added another validation step on top of that: a change that updates the inventory but forgets to regenerate the rules is rejected at merge time. Deployment cannot proceed while the inventory and generated rules are inconsistent.
We redefined “normal” for each chain
Based on the measured block intervals in Section 3, we changed all lag monitoring from block-count thresholds to time-based thresholds. Every chain is now evaluated against the same condition: “the node remains at least 600 seconds behind for 15 minutes.”
We added two more checks during the same review.
- We added self-stall detection to chains that had depended only on an external reference. If we only compare our node with an externally sourced reference value, we cannot detect our own node’s stall when that external reference itself stops moving.
- We added peer-count monitoring. A drop in connected peers is often an earlier signal than block lag.
After the change, we verified that all 47 rules in the affected group were operating normally.
We split the alert path into two independent routes
Route 1. Page critical-severity incidents through PagerDuty
Only alerts with critical severity are sent to PagerDuty. It contacts the responsible operator by phone and push notification, and escalates to the next person if there is no response. The grouping and suppression behavior described in Section 4 is applied here directly.
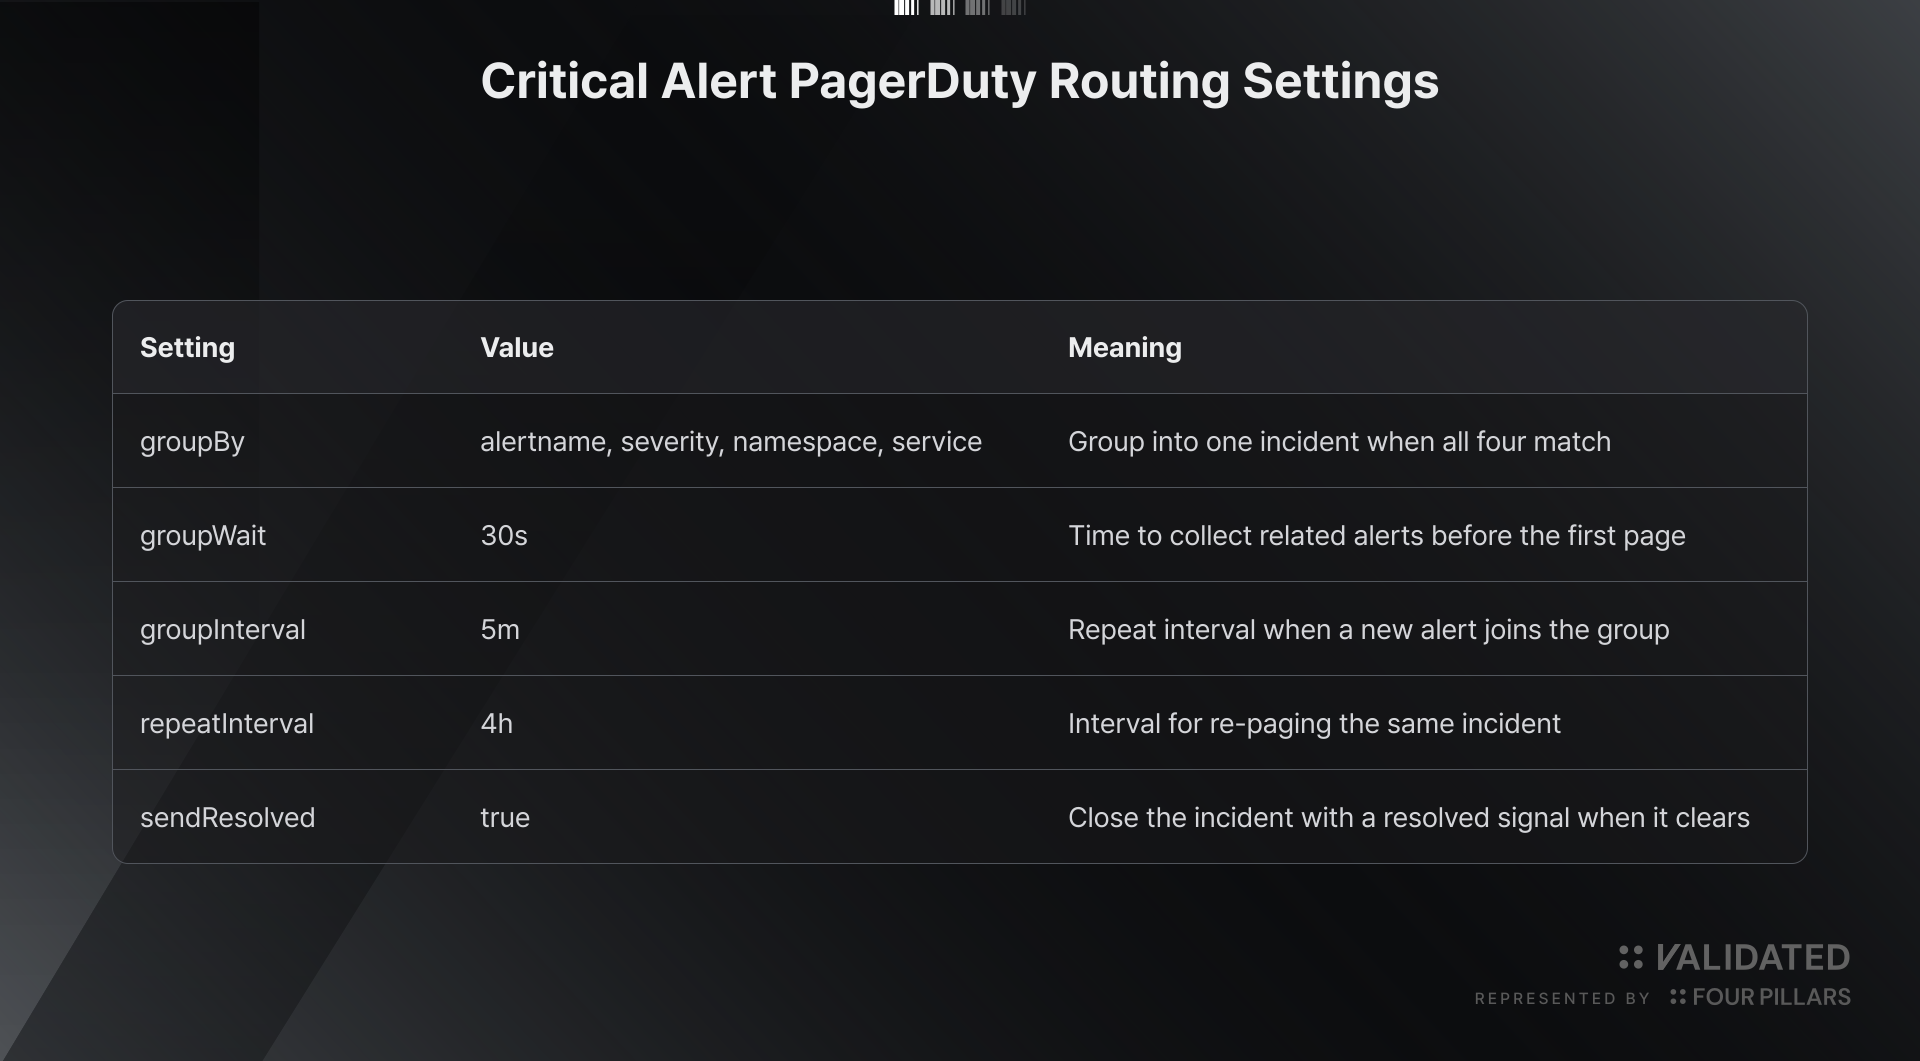
groupBy is why one dead server does not generate ten separate notifications. The page includes the server name, chain, and summary, so the operator can see where the problem is and what happened directly from the notification screen.
We do not page on warning severity. Something that requires immediate action and something that can wait until morning should not be delivered in the same way.
Credentials used for integrations are not stored in Git. They live in Vault and are retrieved only as needed during deployment. This structurally prevents credentials from being committed to a repository.
Route 2. Automatically collect logs and metrics after an alert fires
To reduce the investigation time after an alert arrives, we run our own investigation agent. It runs inside our infrastructure rather than sending cluster information to an external SaaS (Software as a Service) provider.
The sequence is as follows.
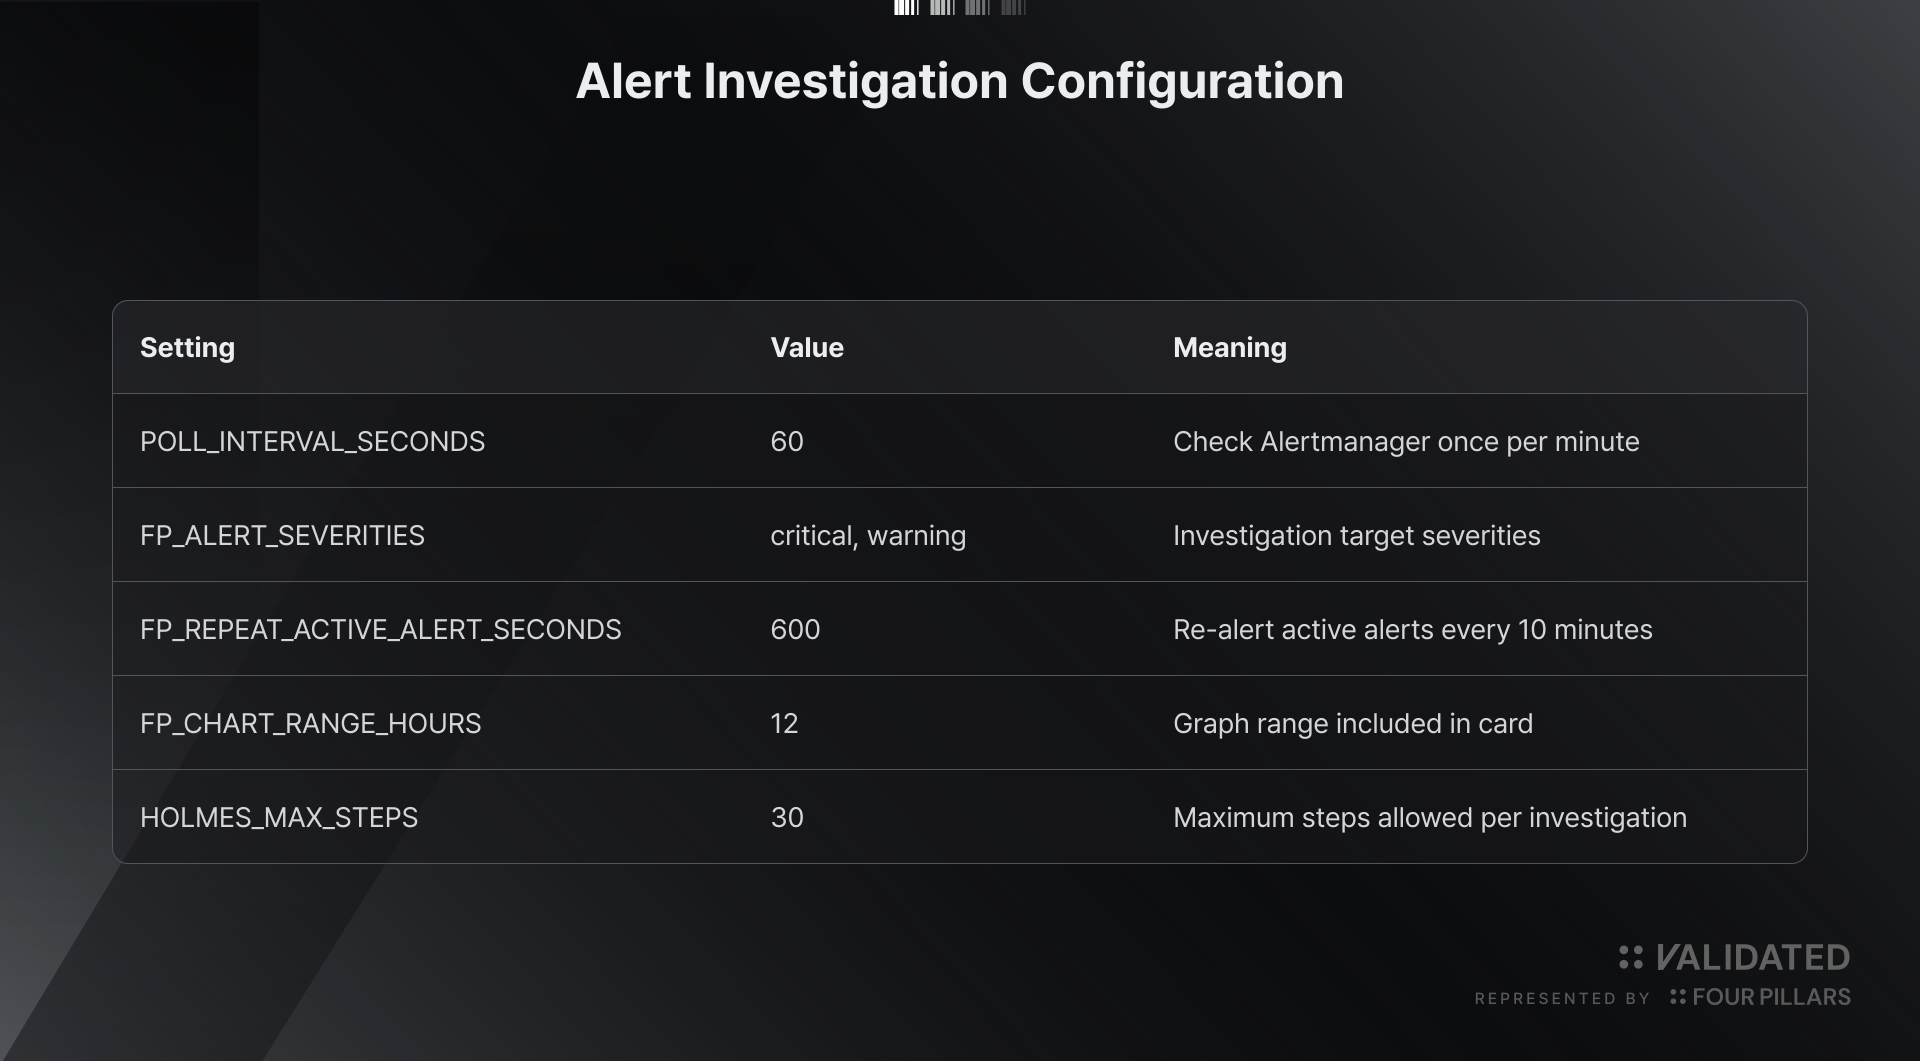
- Poll Alertmanager once per minute for newly firing alerts. Both
criticalandwarningare included. - When an alert is found, start the investigation: inspect the relevant container state, read logs, and query metrics.
- Summarize the investigation in a single Slack card.
The main configuration values are:
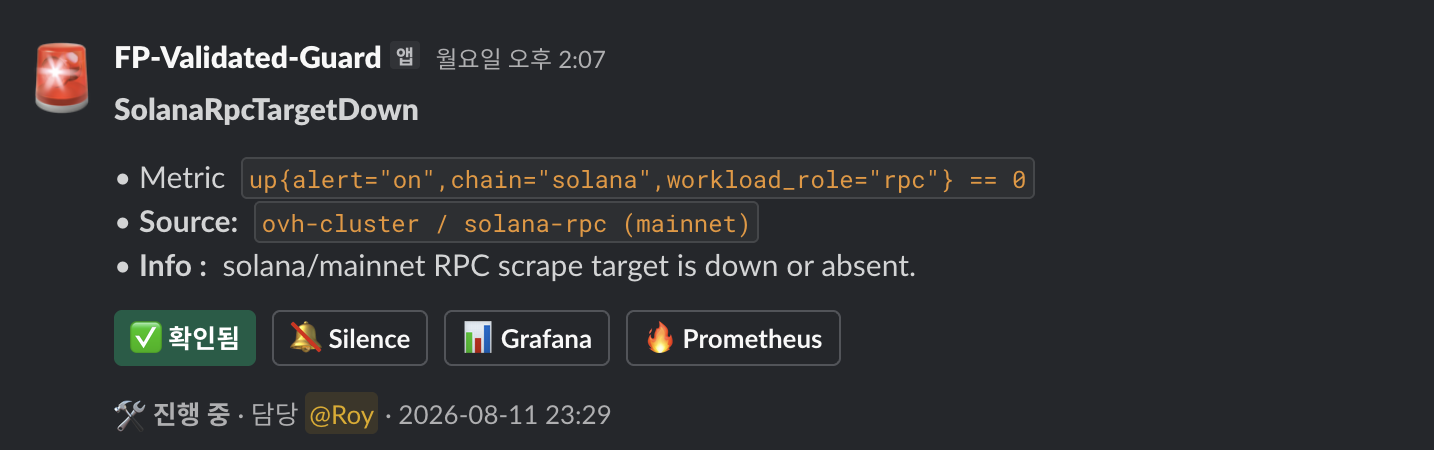
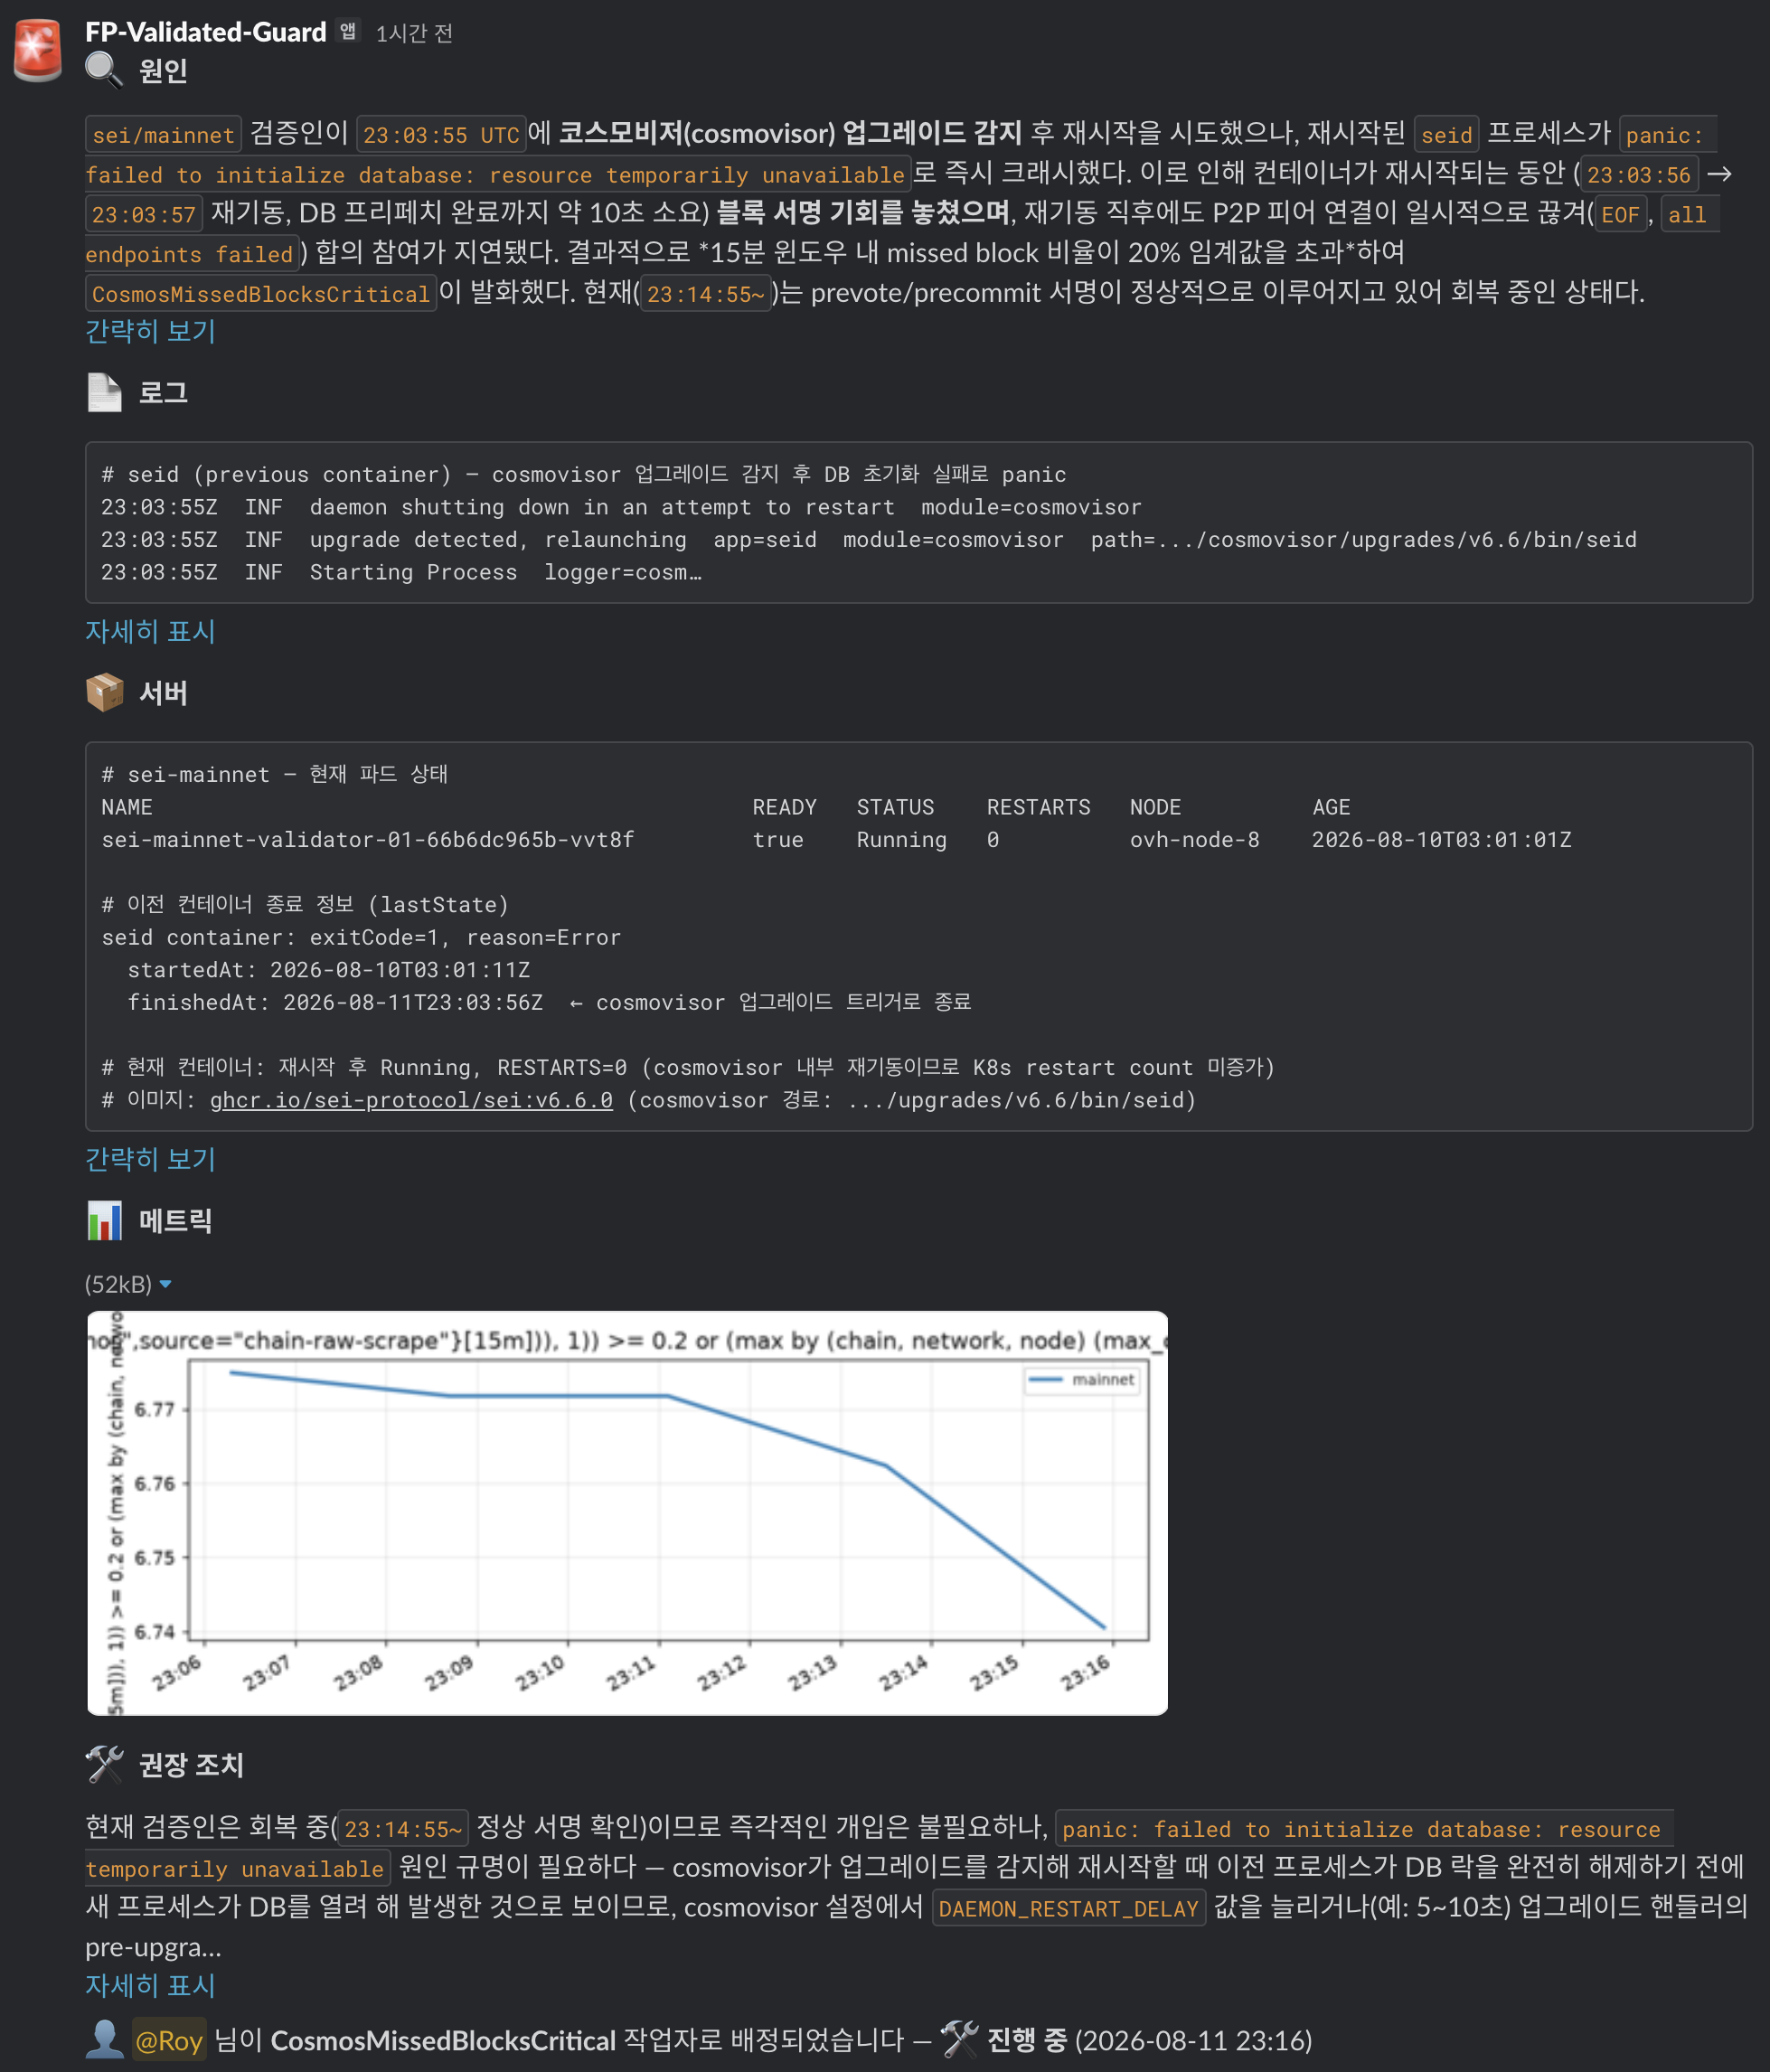
The resulting card has two layers. The top-level card shows the alert name, key metrics, and four action buttons.
The thread contains the investigation results in the order cause → logs → server state → graph → recommended action. It also includes a chart covering the previous 12 hours.
Because the agent first collects container state, logs, events, and metrics, the operator can start by reviewing the investigation results instead of spending time gathering the initial evidence manually.
The buttons are functional as well. “Acknowledged” records who clicked it in the thread, preventing duplicate response. “Silence temporarily” creates an actual silence in Alertmanager. The response can therefore be handled from the same place where the alert is received. Channels are also separated by severity, so urgent incidents and informational items do not get mixed together.
The investigation agent has read-only permissions. It can read container lists, logs, events, and metrics, but it cannot restart, delete, or modify anything.
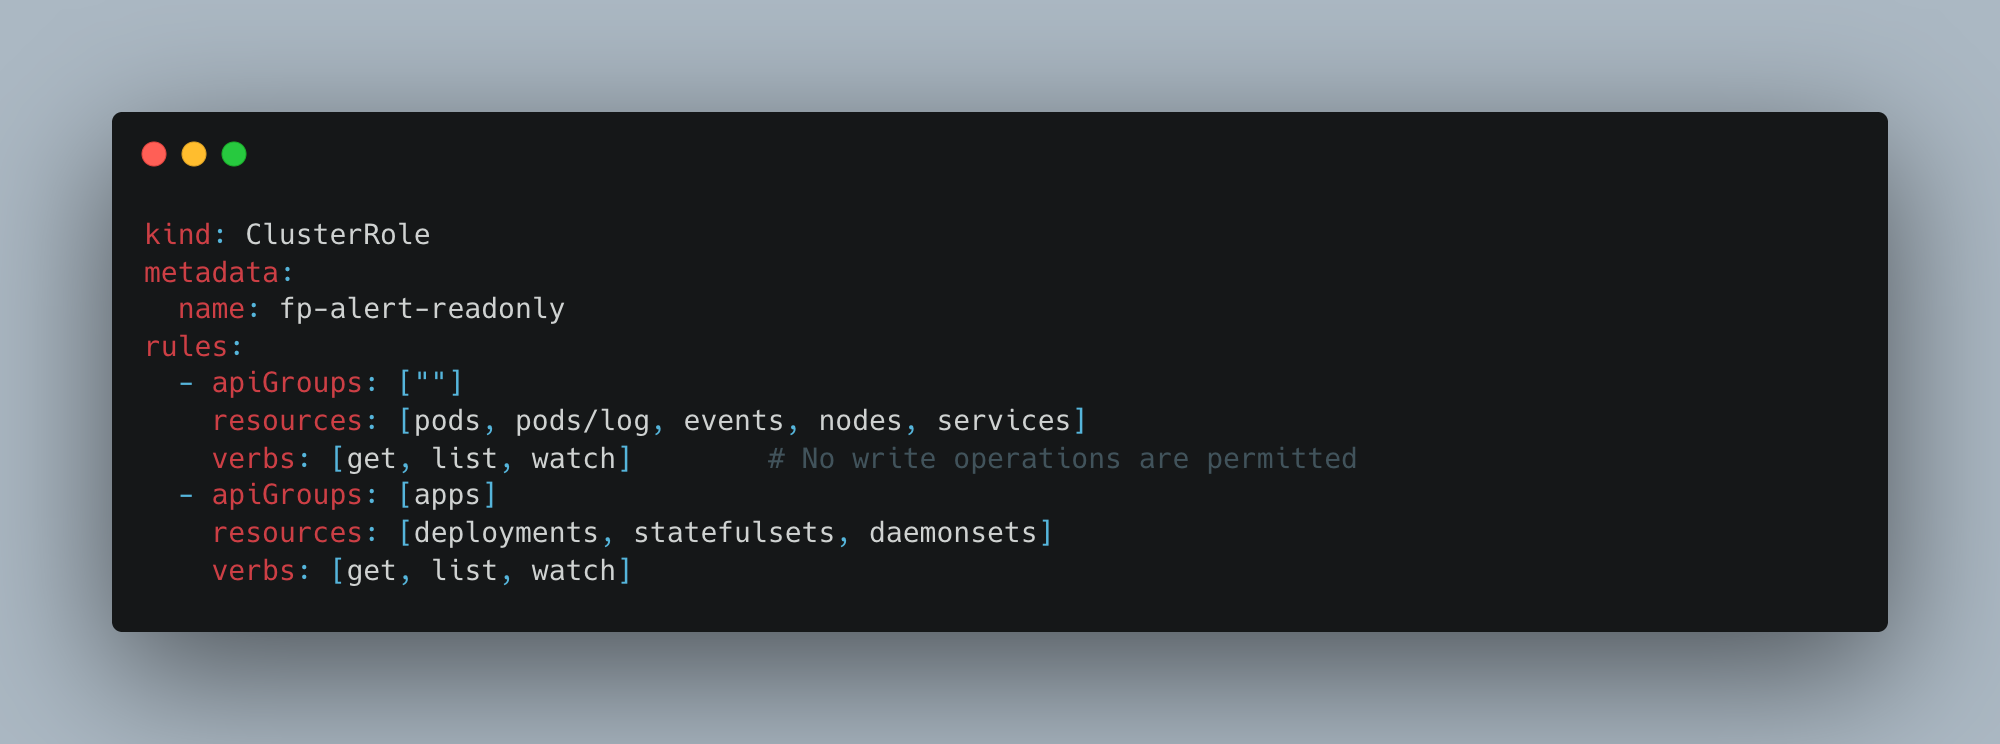
Its ClusterRole contains only get, list, and watch. Restart, deletion, and modification are rejected by the Kubernetes API.
The report format is not left loosely inside a prompt either; it is fixed in a separate file. Changing the model or refining the wording does not change the card structure.
The two routes operate independently
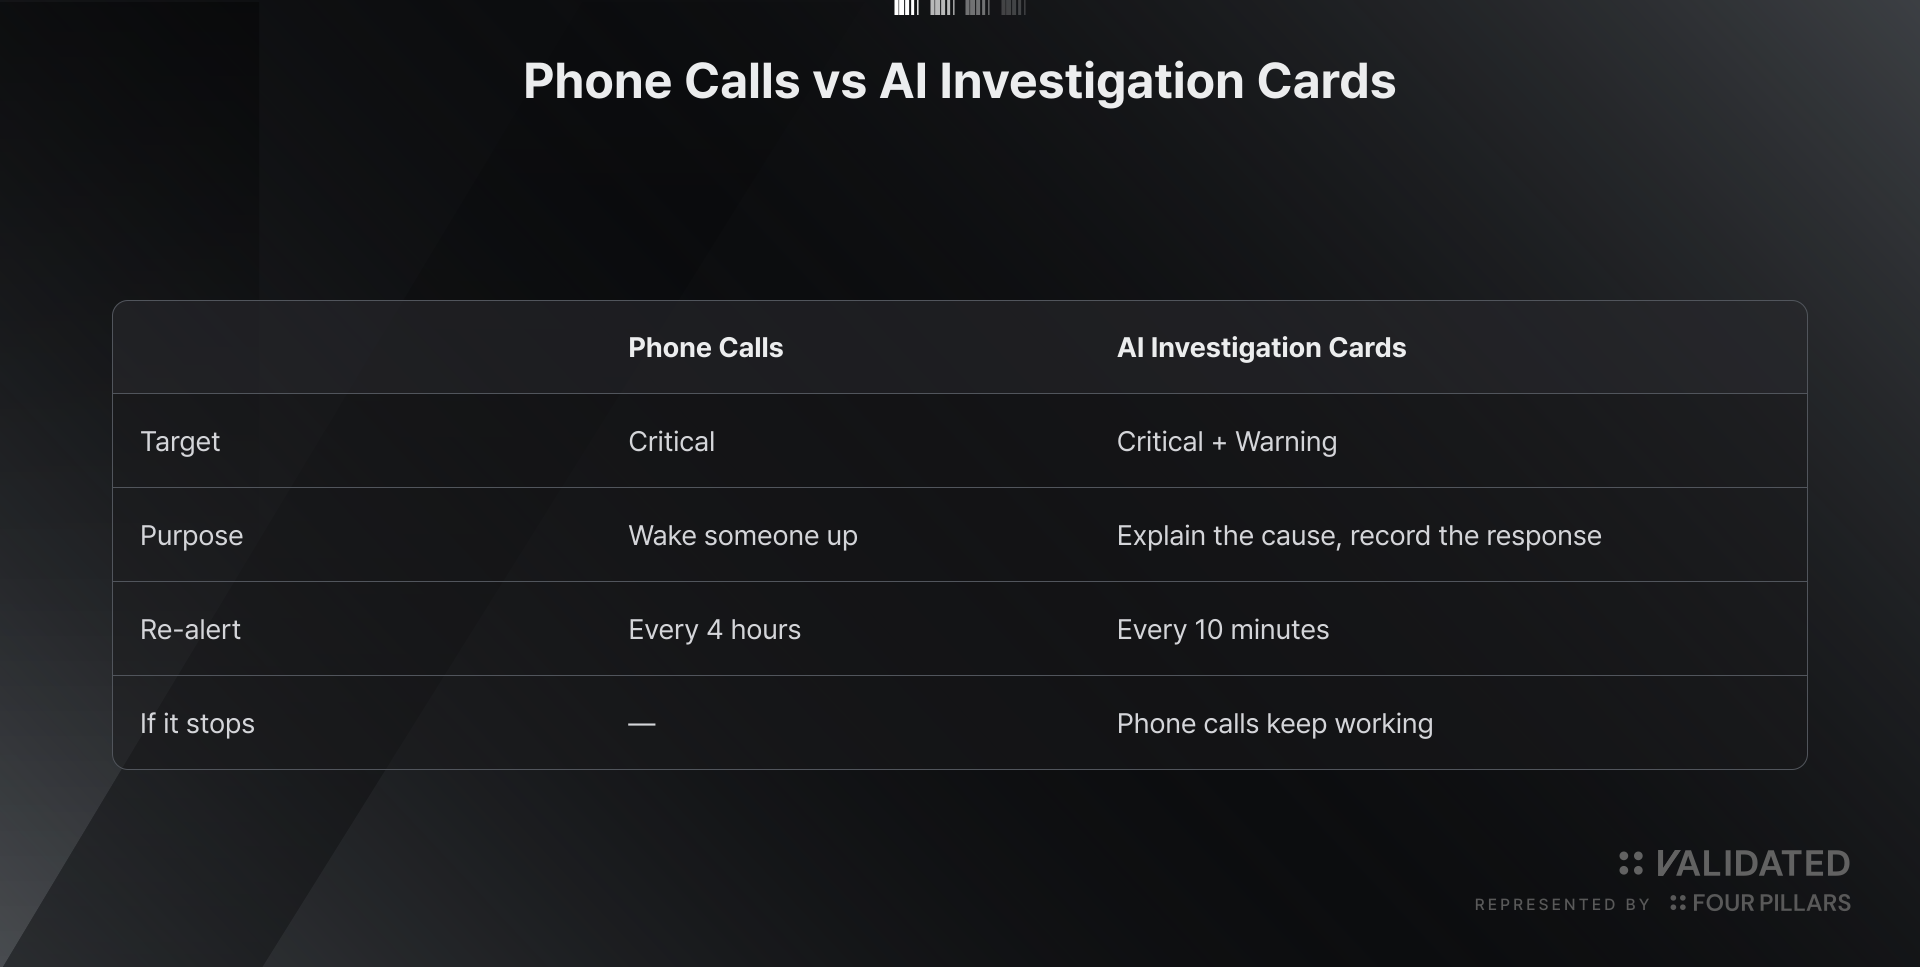 The investigation agent uses only Alertmanager’s query interface. It is not part of the notification-delivery path. As a result, changing the card layout cannot break the page that wakes someone at night.
We record maintenance-time alert suppression in Git as well
There will always be times when alerts need to be temporarily disabled for maintenance. Instead of creating an ad hoc suppression directly in the alerting system, we disable the relevant entry in the node inventory file and merge that change.
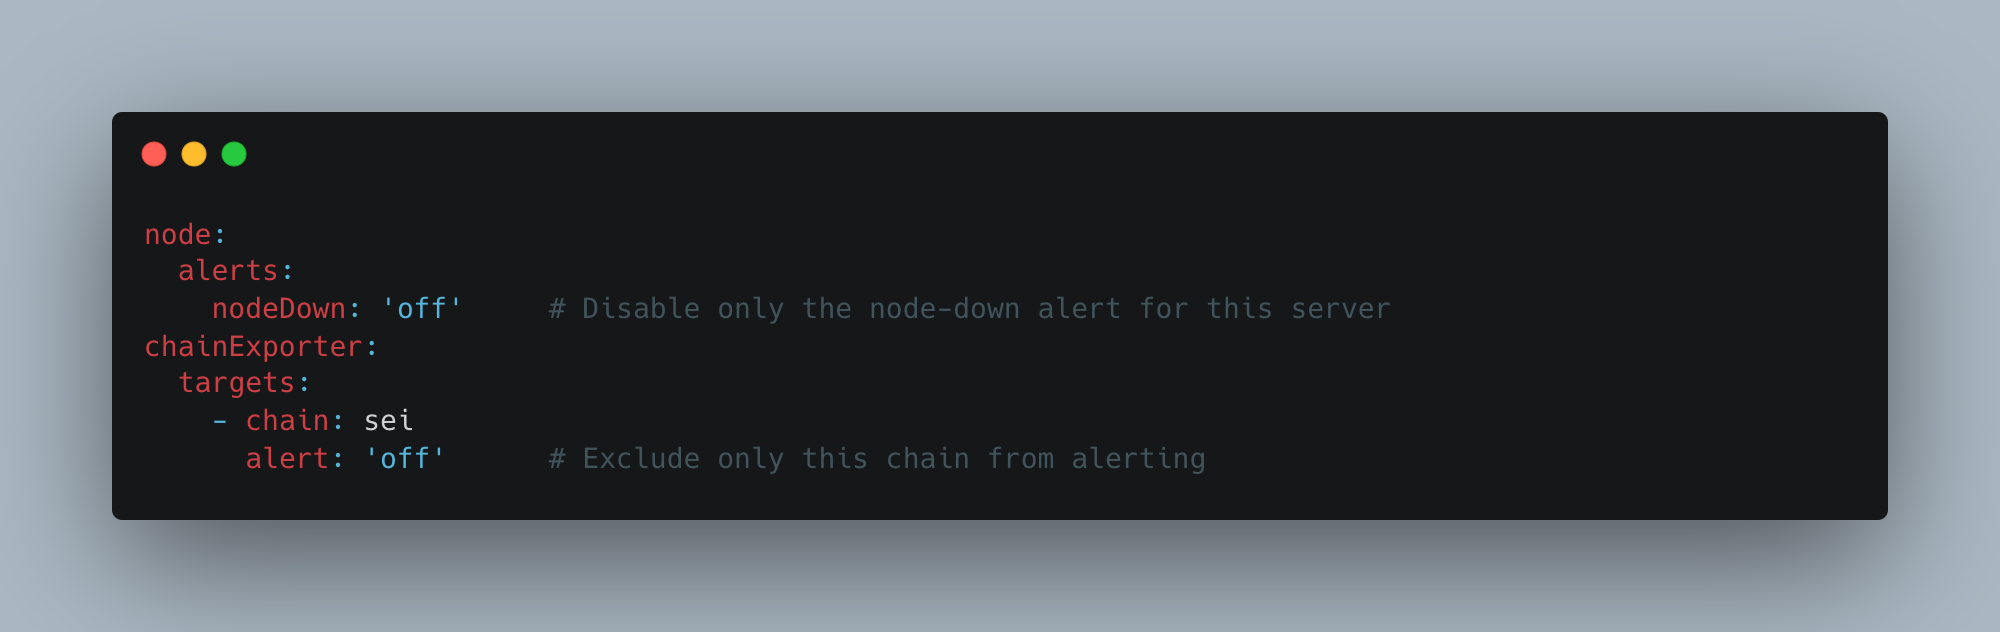
Measurement continues. Graphs keep being generated; only evaluation is disabled for that target. Because the change is recorded in version history, we can later see who disabled what, when, and why. Rules are only allowed to positively select enabled targets, such as alert="on". Patterns such as alert!="off", which merely exclude explicitly disabled targets, are rejected by validation. This prevents a target with the label missing entirely from silently entering the monitoring set.
Disabling one chain does not silence server-level absence monitoring for the entire node. The two controls are separate. If the server dies while one chain is under maintenance, the server-down alert still fires.
We validate monitoring configuration before merge
When the monitoring system itself breaks, it does not send an alert about its own failure; it simply becomes silent. Whenever a proposed change is opened, eleven CI (Continuous Integration) checks run automatically before merge. Running make verify-all locally executes all of them in one command.
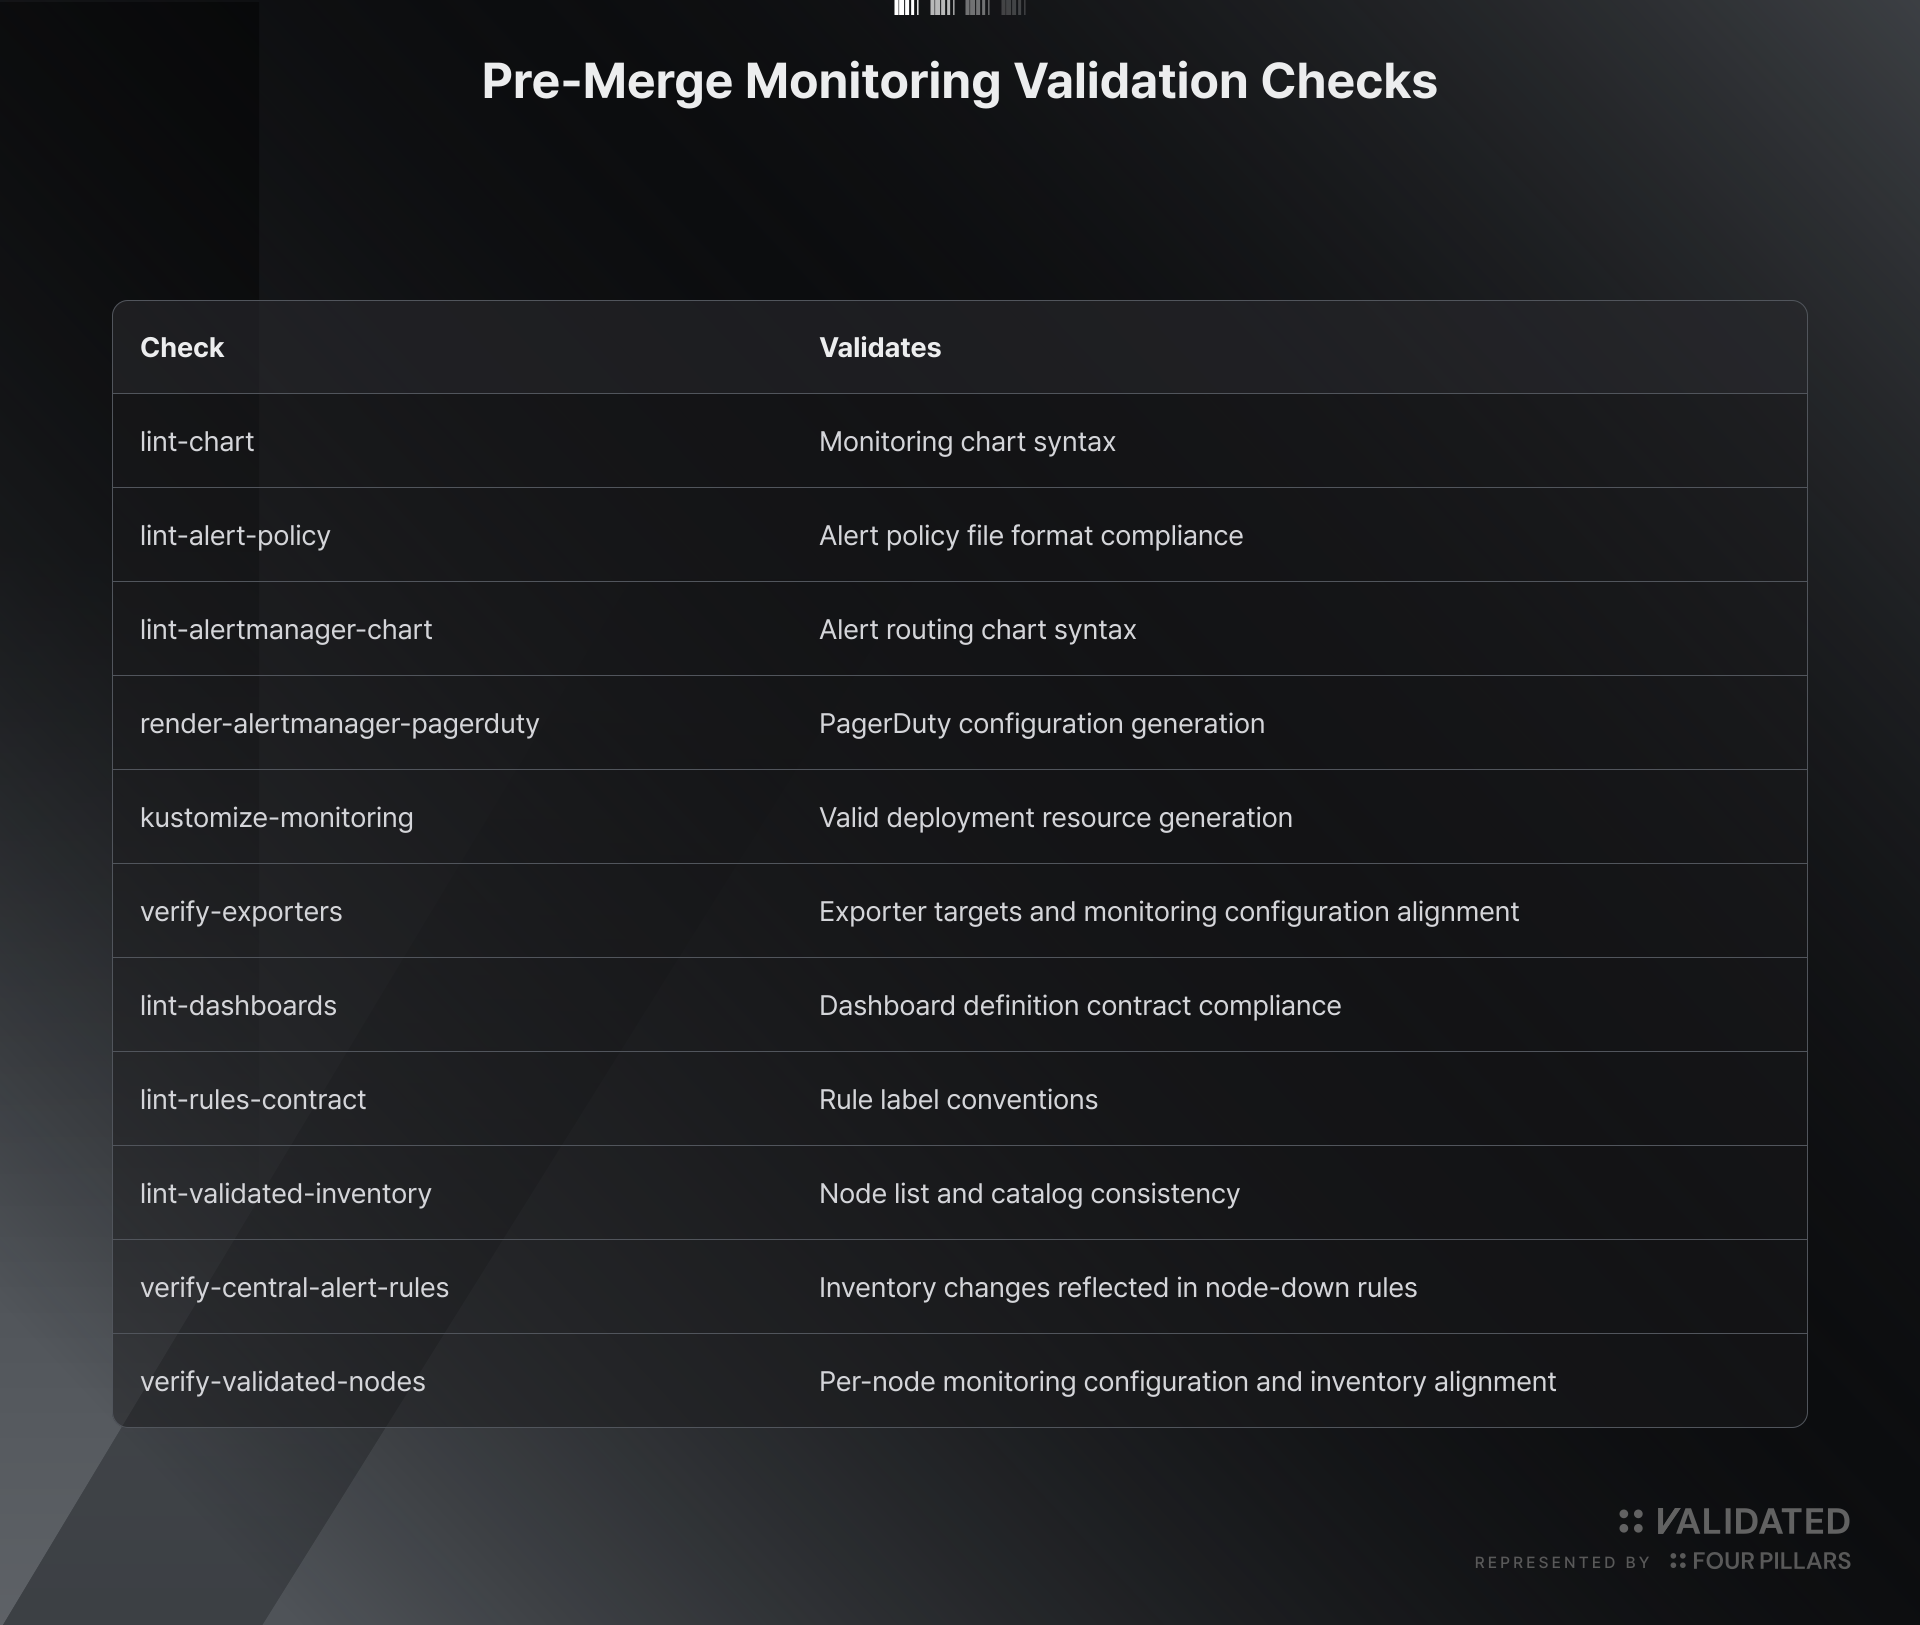 All of these checks run entirely against the repository without touching the cluster. Invalid monitoring configuration is caught before it reaches production.
Deployment does not rely on manual intervention
Every configuration described so far lives in Git, and Argo CD continuously reconciles Git with the actual cluster. When Git changes, the cluster follows. If someone manually changes the cluster, Argo CD restores the declared state.
The deployment order is defined as well. Storage and Alertmanager come up first; evaluation rules and notification routes are layered on top; and per-node monitoring configuration is applied last. One per-node monitoring configuration is generated automatically for each node inventory file.
We also added a safety guardrail: in clusters that run validators, we disable “it disappeared from Git, so delete it from the cluster too.” Monitoring resources that are easy to recreate may still be pruned automatically, but actual validator workloads are never removed without human confirmation. The repositories and namespaces that Argo CD is allowed to modify are restricted by an allowlist as well.
We separated dashboards from alert execution
Dashboards are screens for humans. Alert evaluation must work independently of whether anyone is looking at those screens.
That is why Grafana’s built-in alerting is disabled, while evaluation and delivery are handled entirely by Prometheus and Alertmanager. Grafana accounts are integrated with internal authentication and access is separated by role. Changing a dashboard therefore cannot affect alert execution.
Summary
1. The same tools can produce very different results. Everyone can use Prometheus and Grafana. The difference comes from whether target inventory is system-managed, whether “normal” is defined appropriately per target, and whether evaluation criteria are centralized with an auditable history.
2. Silent failures need their own detection mechanisms. Abnormal values are visible. No value arriving at all, a rule no longer targeting something it should, or an alert being disabled and forgotten are all silent failures. Absence detection and automated validation cover these three cases.
3. The time after the alert arrives is part of the real loss. Even if an incident is detected in 3 minutes, a 30-minute investigation means 33 minutes lost. Whether an alert arrives with a likely cause and supporting evidence, and whether the team can see the current response status, directly affects availability.